Practice Changes in Blood Glucose Management Following Open Heart Surgery: From a Prospective Randomized Study to Everyday Practice
![]()
Publication
European Journal of Cardio-Thoracic Surgery
Date
April 2015
Authors
Niv Ad, Henry Tran, Linda Halpin, Alan Speir, Anthony Rongione, Graciela Pritchard, Sari Holmes
ABSTRACT
Objectives: Targeted blood glucose (BG) levels following cardiac surgery continues to be debated. According to the Society of Thoracic Surgeons (STS) guidelines, BG should be kept <180 mg/dl following cardiac surgery. However, our practice and others shifted to a stricter BG control (90–110 mg/dl) based on data suggesting an association with improved outcome. Recently, we conducted a randomized control study that demonstrated no added value to stricter control over liberal control (120–180 mg/dl). As a result, we shifted our management accordingly. The purpose of this study was to evaluate the impact that this change to a more liberal BG management (BGM) had on patient outcomes at our centre.
Methods: BGM was changed in June 2011 from strict (90–110 mg/dl) to liberal (120–180 mg/dl). Insulin drips, managed through a computerized algorithm, controlled BG for the first 72 h post surgery. Consecutive cardiac surgery patients operated on throughout 1 year prior to BGM change (n = 934) were propensity score matched to patients operated on throughout 1 year after the change (n = 927).
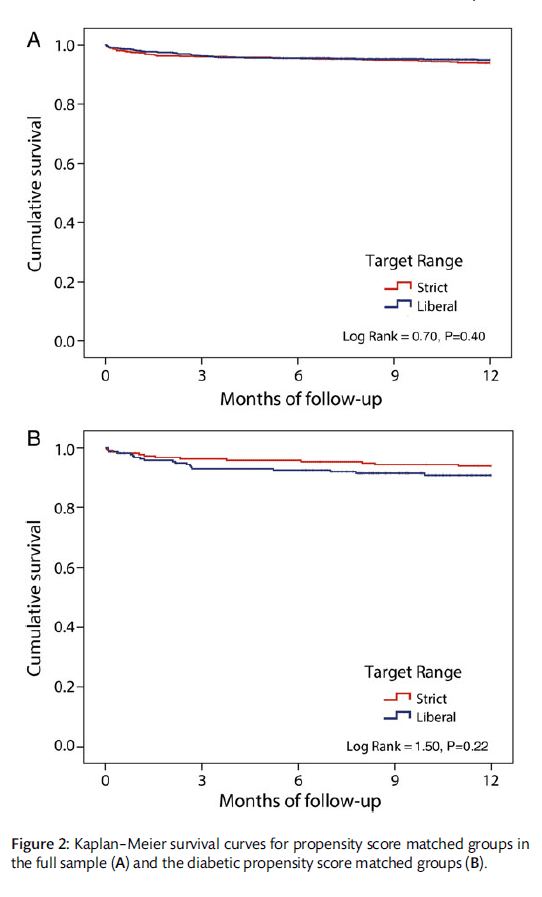
Results: After matching, there were 846 patient pairs. There was no difference between cohorts for length of stay and perioperative complications, and both cohorts achieved acceptable outcomes. Incidence of perioperative renal failure (P = 0.02) and renal failure requiring dialysis (P = 0.004) were better for the cohort with liberal BGM. One-year cumulative survival did not differ between cohorts (log-rank = 0.70, P = 0.40).
Conclusions: Implementation of glycaemic control of 120–180 mg/dl into clinical practice was not associated with increased morbidity. The present results confirm our prior findings that a more liberal glycaemic control strategy to maintain BG is equal to a stricter target range. These findings are important for patient care and demonstrate the safety and efficacy of practice change for all patients following a successful randomized controlled trial.
INTRODUCTION
Hyperglycaemia following cardiac surgery is very common, whether a patient has a history of diabetes mellitus or not. Several studies examining critically ill patients and those undergoing cardiac surgery have demonstrated a deleterious association between hyperglycaemia and clinical outcomes [1]. Therefore, the management of perioperative hyperglycaemia during coronary artery bypass graft (CABG) surgery and all cardiac surgical procedures has been the focus of intensive study in recent years [2-5]. It was shown that control of glucose could improve patient outcomes and reduce the morbidity associated with the procedure and long-term outcome [4-6]
In recent years, a debate evolved surrounding the degree of glucose control to be recommended. Although there is an established consensus related to the negative effect of hyperglycaemia in patients following CABG, the optimal degree of glucose control has not yet been clearly elucidated. The current guidelines of the Society of Thoracic Surgeons (STS) recommend that serum glucose be maintained at less than 180 mg/dl while patients recover in the intensive care unit. The guidelines further specify that a subset of patients who require prolonged ventilation, inotropic support or renal replacement therapy should have a serum glucose goal of less than 150 mg/dl [7].
Recently, we published a prospective, randomized control study using non-inferiority analyses, which found that a liberal goal (120–180 mg/dl) was not inferior for perioperative morbidity compared with a strict serum glucose target (90–110 mg/dl) in patients undergoing CABG surgery [8]. Based on the results of this trial, the postoperative management of hyperglycaemia was changed at our institution. The purpose of this study was to assess the potential impact of implementing our randomized controlled trial (RCT) results, which suggests a more liberal glycaemic control (120–180 mg/dl), on our cardiac surgical population outcomes.
METHODS
This study was a retrospective cohort study in which all data were collected prospectively between June 2010 and June 2012. The study was designed to allow a comparison of all consecutively operated patients during one full year prior to implementation of the conclusions of our RCT with blood glucose (BG) control at 90–110 mg/dl with one full year following implementation of BG control at 120–180 mg/dl [8]. All consecutive cardiac surgery patients from 1 year prior to the BG management (BGM) change (n = 934; June 2010 to June 2011) and 1 year following the BGM change (n = 927; June 2011 to June 2012) were eligible to be included in the present analyses, except for those patients included in the original RCT study. Data from our local cardiac surgery database were merged with survival information from the Social Security Death Index and the National Death Index. The STS database definitions were used for preoperative characteristics and postoperative outcomes.
Blood glucose management
Following a randomized controlled trial at our institution investigating effectiveness of strict versus liberal BGM, institutional standard of care for post-cardiac surgery BGM was changed in June 2011 from a strict range (90–110 mg/dl) to a more liberal range (120–180 mg/dl) [8]. For all patients before and after the BGM change, continuous insulin drips were managed through a computerized algorithm using the Glucommander™ software and controlled BG during surgery and for the first 72 h after surgery [9]. Target BG ranges are loaded into the software via computer at the bedside, and the algorithm guides staff in the appropriate IV fluids to infuse in order to reach or remain within the target range. Data on hypoglycaemic events and number of BG readings are captured with a software programme.
Statistical analysis
Continuous data are presented as mean ± standard deviation (SD), and categorical data are presented as frequency (percentage) unless otherwise noted. Patient groups were compared using χ2 or Fisher’s exact test for preoperative and postoperative categorical variables and Student’s independent samples t-test or Mann–Whitney U-test for continuous measures as appropriate, based on parametric test assumptions. Logistic regression was used for multivariate analysis of outcomes. The BGM groups were compared on 1-year cumulative survival using Kaplan–Meier survival analysis. Statistical significance was considered P < 0.05, two-tailed. All analyses were conducted using SPSS version 17.0 (SPSS, Inc., Chicago, IL, USA) or R version 2.10.1 (The R Foundation for Statistical Computing).
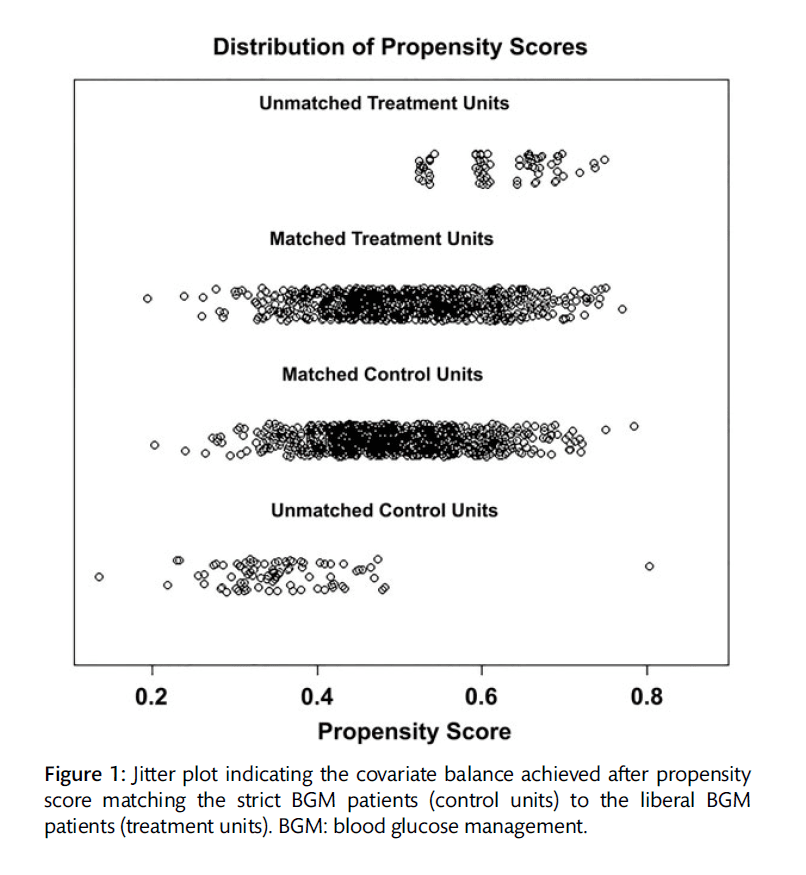
To simulate randomization and control for important clinical variables, patients with strict BGM were propensity score matched to those with liberal BGM. Propensity score matching (PSM) was conducted using the MatchIt package within R to improve covariate balance between the two BGM era groups. Propensity scores were estimated using a logistic model and matched between the groups within a calliper of 0.25 propensity score SDs. The factors in the model were determined a priori and included age, gender, diabetes, hypertension, congestive heart failure (CHF), ejection fraction, previous cardiac surgery, creatinine >2 mg/dl, chronic pulmonary disease (CPD), peripheral vascular disease, cerebrovascular disease, angina, body mass index, emergent status, cardiopulmonary bypass time, type of surgery (CABG, valve surgery and Cox maze procedure) and additive EuroSCORE. After matching, covariate balance was improved for all factors (Fig. 1), and 1692 patients (846 pairs) remained for all analyses described as matched or PSM.
PSM was conducted a second time only within the patients with preoperative diabetes mellitus in the full sample, including 275 strict cohort patients and 244 liberal cohort patients. All methodologies of this PSM were identical to the description above, except that diabetes was not included as a factor in the propensity score model. After matching, the covariate balance was improved and 436 patients (218 pairs) remained for all analyses described as matched in the diabetic sample.
RESULTS
Patient characteristics
The mean age for the entire sample (n = 1861) was 63.5 ± 12.2 years, with 28% female patients. Prior to matching, there were several differences between the cohort groups in comorbid conditions (Table 1). The strict target range group had a higher prevalence of hypertension (76 vs 70%, P = 0.002) and CHF (34 vs 25%, P < 0.001) and a lower prevalence of CPD (14 vs 20%, P < 0.001). Also the percentage of patients with certain types of surgery differed by group. Specifically, in the strict target cohort, there were more patients with CABG surgeries (57 vs 50%, P = 0.002) and fewer patients with valve surgeries (43 vs 48%, P = 0.03), although it should be noted that these categories were not mutually exclusive. After PSM, the cohort groups no longer differed significantly on any preoperative characteristics, and balance was achieved across these factors similar to the effect that randomization would have on patient characteristics (Table 1 and Fig. 1). In addition, the group of patients who were unmatched after PSM (n = 169) differed from the matched sample only on a few preoperative characteristics, including higher additive EuroSCORE (7.2 ± 3.8 vs 6.2 ± 3.6, P = 0.001), greater percentage with CHF (44 vs 28%, P < 0.001) and greater percentage with CPD (25 vs 16%, P = 0.005). There were no significant differences between the unmatched and matched samples on perioperative outcomes.
Table 1. Patient characteristics prior to and after propensity score matching
| Non-Matched Groups | Matched Groups | |||
|---|---|---|---|---|
| Strict (n = 934) | Liberal (n = 927) | Strict (n = 846) | Liberal (n = 846) | |
| Age, mean years ± SD | 63.8 ± 12.2 | 63.1 ± 12.2 | 63.5 ± 12.4 | 63.2 ± 12.1 |
| Female | 258 (28) | 261 (28) | 231 (27) | 234 (28) |
| Addictive EuroSCORE | 6.4 ± 3.6 | 6.3 ± 3.7 | 6.3 ± 3.6 | 6.2 ± 3.6 |
| Diabetes mellitus | 275 (29) | 244 (26) | 243 (29) | 229 (27) |
| Insulin-dependent | 83 (30) | 69 (28) | 72 (30) | 65 (28) |
| Body mass index (kg/m2) | 29.0 ± 11.4 | 28.1 ± 6.8 | 28.4 ± 7.0 | 28.3 ± 6.9 |
| Hypertensiona | 708 (76) | 644 (70) | 631 (75) | 600 (71) |
| CHFa | 316 (34) | 234 (25) | 251 (30) | 224 (27) |
| Ejection fraction (%) | 52.7 ± 13.9 | 53.1 ± 13.2 | 52.8 ± 13.7 | 53.1 ± 13.3 |
| Angina | 301 (32) | 284 (31) | 275 (33) | 266 (31) |
| Cerebrovascular disease | 124 (13) | 121 (13) | 109 (13) | 109 (13) |
| Previous cerebrovascular accident | 74 (8) | 66 (7) | 62 (7) | 61 (7) |
| CPDa | 132 (14) | 187 (20) | 130 (15) | 147 (17) |
| Creatinine >2 mg/dl | 38 (4) | 43 (5) | 36 (4) | 38 (4) |
| Peripheral vascular disease | 91 (10) | 76 (8) | 77 (9) | 70 (8) |
| Previous cardiac surgery | 84 (9) | 95 (10) | 79 (9) | 82 (10) |
| Emergent status | 69 (7) | 73 (8) | 64 (8) | 65 (8) |
| Type of surgeryb | ||||
| CABGa | 531 (57) | 462 (50) | 466 (55) | 441 (52) |
| Valve surgerya | 404 (43) | 447 (48) | 373 (44) | 391 (46) |
| Cox maze | 100 (11) | 121 (13) | 94 (11) | 105 (12) |
| Cardiopulmonary bypass time (min) | 119.2 ± 52.2 | 123.5 ± 50.9 | 119.6 ± 52.9 | 122.1 ± 50.4 |
CHF: congestive heart failure; CPD: chronic pulmonary disease; CABG: coronary artery bypass graft.
aSignificant difference in factor between non-matched groups (P < 0.05).
bSurgery categories are not mutually exclusive.
Perioperative Outcomes
After matching, both cohorts achieved acceptable early outcomes, as shown in Table 2. Analyses indicated that the cohort with a liberal target range did not experience significantly more complications, including deep sternal wound infection (P = 0.13), permanent stroke (P = 0.25), pneumonia (P = 0.49) and operative mortality (<30 days; P = 0.64). There was also no increase in length of stay for the liberal target range cohort, with a median stay of 5 days for both groups (P = 0.82), and readmissions within 30 days were comparable (10% in each group, P = 1.00). The three major reasons for readmission were arrhythmia/heart block, pericardial effusion/tamponade and pleural effusion in both the strict (21, 20 and 7% of readmits, respectively) and liberal (14, 14 and 6% of readmits, respectively) target range cohorts. Despite good matching in preoperative renal function, there was a significant difference in postoperative renal failure (3.5 vs 1.7%, P = 0.02) and renal failure requiring dialysis (1.9 vs 0.4%, P = 0.003), with the lower incidence of these outcomes in the liberal target cohort. Analysis of perioperative complications on the full non-matched sample indicated the same pattern of results across all outcomes, including the positive effect of liberal target range cohort on renal failure (3.5 vs 1.6%, P = 0.01) and dialysis (1.8 vs 0.4%, P = 0.005). Even after adjusting for the type of procedure (CABG, valve and Cox maze), the liberal target cohort had a lower risk for renal failure than did the strict target cohort in both the PSM [odds ratio (OR) = 0.47, 95% confidence interval (95% CI): 0.25–0.89, P = 0.021] and non-matched samples (OR = 0.47, 95% CI: 0.25–0.87, P = 0.016). The same result was found after adjustment for the type of procedure for renal failure requiring dialysis in the PSM (OR = 0.19, 95% CI: 0.05–0.65, P = 0.008) and non-matched samples (OR = 0.24, 95% CI: 0.08–0.71, P = 0.01).
Table 2. Perioperative outcomes in propensity score matched groups
| Variable | Strict (n = 846) | Liberal (n = 846) | Difference | 95% CI | P-value |
|---|---|---|---|---|---|
| Median [IQR] hours in ICU | 31.05 [17.23–77.53] | 29.37 [14.15–84.35] | 1.7 | -1.93 to 5.30 | 0.45 |
| Median [IQR] length of stay (days) | 5 [4–8] | 5 [3–9] | 0.0 | -0.49 to 0.49 | 0.82 |
| Operative death (30 days) | 23 (2.7) | 20 (2.4) | 0.3 | -1.21 to 1.81 | 0.64 |
| Deep sternal wound infectiona | 4 (0.5) | 0 | 0.5 | 0.03 to 0.97 | 0.13 |
| Septicaemia | 12 (1.4) | 15 (1.8) | 0.4 | -0.80 to 1.60 | 0.56 |
| Permanent stroke | 11 (1.3) | 17 (2.0) | 0.7 | -0.52 to 1.92 | 0.25 |
| Prolonged ventilation | 109 (13) | 116 (14) | 1.0 | -2.25 to 4.25 | 0.62 |
| Pneumonia | 30 (4) | 25 (3) | 1.0 | -0.74 to 2.74 | 0.49 |
| Reoperation for bleeding | 14 (1.7) | 17 (2.0) | 0.3 | -0.99 to 1.59 | 0.59 |
| Renal failure | 30 (3.5) | 14 (1.7) | 1.8 | 0.29 to 3.31 | 0.02 |
| Renal failure requiring dialysis | 16 (1.9) | 3 (0.4) | 1.5 | 0.48 to 2.52 | 0.003 |
| Postoperative blood products | 169 (20) | 184 (22) | 2.0 | -1.88 to 5.88 | 0.37 |
| Readmission within 30 days | 86 (10) | 86 (10) | 0.0 | -2.86 to 2.86 | 1.00 |
Data presented as frequency (%) or median [interquartile range].
IQR: interquartile range; CI: confidence interval.
aFisher’s exact test used for comparison.
One of the potential risks of a stricter glycaemic control is hypoglycaemic events. Analysing data from the Glucommander™ system for a subset of matched patients (strict = 458 and liberal = 525) indicated that the incidence of severe hypoglycaemic events with BG <40 mg/dl did not differ between the groups (1.5 vs 1.0%, P = 0.41), but the incidence of moderate hypoglycaemic events with BG <70 mg/dl was considerably lower in the liberal target range cohort (13 vs 61%, P<0.001). In addition, continuous assessment of BG levels presents a challenge for glycaemic management. A comparison of the number of BG tests and readings per patient in both groups revealed that the mean number of BG readings required for the strict range cohort was significantly higher than the liberal range cohort (62.4 ± 60.8 vs 53.8 ± 57.2, t = 2.28, P = 0.02). However, there was no difference between the strict and the liberal range cohorts in variability of BG measurements as defined by the SD of BG readings for each patient (28.8 vs 28.5, t = 0.36, P = 0.72).
Perioperative outcomes in diabetic patients
After PSM in the diabetic patients only, both cohorts achieved acceptable early outcomes, as shown in Table 3. Analyses indicated that the diabetic patient cohort with a liberal target range did not experience significantly more complications, including deep sternal wound infection (P = 1.00), permanent stroke (P = 1.00), pneumonia (P = 0.28), renal failure (P = 0.36), renal failure requiring dialysis (P = 0.18) and operative mortality (<30 days; P = 0.28). There was also no increase in length of stay for the liberal target range cohort, with a median stay of 6 days for both groups (P = 0.97), and readmissions within 30 days were comparable (P = 0.88). In the group of patients with diabetes, reasons for readmissions were evenly spread across multiple categories in both the strict and liberal target range cohorts, with no clear main categories. In the subset of matched diabetic patients with Glucommander™ data available (strict = 115 and liberal = 129), the incidence of severe hypoglycaemic events with BG <40 mg/dl was higher for the strict glucose control cohort, but not statistically significant (2.6 vs 0.8%, P = 0.35), while the incidence of moderate hypoglycaemic events with BG <70 mg/dl was significantly higher in the strict target range cohort (67 vs 15%, P < 0.001). Also, mean BG readings were similar for matched diabetic patients in the strict versus liberal target range cohorts (70.6 ± 59.3 vs 73.3 ± 102.3, t = −0.25, P = 0.80).
Table 3. Perioperative outcomes for propensity score matched groups in patients with diabetes only
| Variable | Strict (n = 846) | Liberal (n = 846) | Difference | 95% CI | P-value |
|---|---|---|---|---|---|
| Median [IQR] hours in ICU | 31.1 [12.7–96.4] | 33.9 [15.6–104.1] | 2.8 | -16.78 to 11.13 | 0.73 |
| Median [IQR] length of stay (days) | 6 [4–8.3] | 6 [4–11] | 0.0 | -0.69 to 0.69 | 0.97 |
| Operative death (30 days) | 5 (2.3) | 9 (4) | 1.7 | -1.57 to 4.97 | 0.28 |
| Deep sternal wound infectiona | 1 (0.5) | 0 | 0.5 | -0.44 to 1.44 | 1.00 |
| Septicaemia | 5 (2.3) | 8 (3.7) | 1.4 | -1.79 to 4.59 | 0.40 |
| Permanent strokea | 3 (1.4) | 3 (1.4) | 0.0 | -2.20 to 2.20 | 1.00 |
| Prolonged ventilation | 34 (16) | 38 (17) | 1.0 | -5.98 to 7.98 | 0.61 |
| Pneumonia | 14 (6) | 9 (4) | 2.0 | -2.10 to 6.10 | 0.28 |
| Reoperation for bleedinga | 4 (1.8) | 5 (2.3) | 0.5 | -2.17 to 3.17 | 1.00 |
| Renal failure | 12 (6) | 8 (3.7) | 2.3 | -1.72 to 6.32 | 0.36 |
| Renal failure requiring dialysis | 7 (3.2) | 2 (0.9) | 2.3 | -0.35 to 4.95 | 0.18 |
| Postoperative blood products | 49 (23) | 61 (28) | 5.0 | -3.17 to 13.17 | 0.19 |
| Readmission within 30 days | 22 (10) | 23 (11) | 1.0 | -4.76 to 6.76 | 0.88 |
Data presented as frequency (%) or median [interquartile range].
IQR: interquartile range; CI: confidence interval.
aFisher’s exact test used for comparison.
Survival
No difference was found in 1-year cumulative survival between the matched BGM era groups (log-rank = 0.70, P = 0.40; Fig. 2A). The strict group had 1-year cumulative survival of 93.9%, and the liberal group had 1-year cumulative survival of 94.9%. Similarly, in the patients with diabetes, there was no difference in 1-year cumulative survival between the matched BGM era groups (log-rank = 1.50, P = 0.22; Fig. 2B). The strict diabetic group had 1-year cumulative survival of 93.9% and the liberal diabetic group had 1-year cumulative survival of 90.8%.
DISCUSSION
In this study, we assessed the potential impact of a change in the management of glycaemic control at our institute. The change was applied only after a prospective randomized controlled study conducted by us suggested that glycaemic control using a more liberal range of 120–180 mg/dl led to similar perioperative outcomes compared with a strict target range of 90–110 mg/dl following CABG [8]. Our results in this relatively large cohort of patients using a propensity match analysis suggest that the more liberal glycaemic control is not associated with increased perioperative morbidity, and has the same 1-year survival. The strict BG control group showed higher rates of renal failure; however, it showed no increased mortality or morbidity other than that. These findings are somewhat different from other reports from the literature that demonstrated an association between hypoglycaemia and increased complications [10]. The negative role of hypoglycaemia is well documented in recent critical care guidelines published in 2012, where it was suggested that BG ≤70 mg/dl is associated with increased mortality and that even a brief period of hypoglycaemia with BG <49 mg/dl is independently associated with mortality and that the risk increases with prolonged or frequent episodes [11]. The number of BG tests per hospital stay was also found to be significantly higher for the stricter target range group of patients. The significance of this finding is yet to be studied more, as it has the obvious direct impact on cost through working hours and additional tests, but also a potential effect on patient satisfaction.
Of importance, we performed the same analysis using PSM for the patients who presented to surgery with diabetic mellitus, using the STS definitions. The results of this subgroup analysis demonstrated the same trends. We find these results very important, as the more liberal range of glycaemic control in this subgroup of patients seems to be associated with the same perioperative outcomes and 1-year survival. These results seem different from the results published by Ingels et al. [6], suggesting that a strict BG control (80–110 mg/dl) is associated with better survival and quality of life. However, in that particular study, the strict protocol was compared only with a treatment regimen that included intermittent intravenous insulin when BG levels were found higher than 220 mg/dl.
The negative effect of hyperglycaemia on patients following cardiac surgery is well documented [5, 12]. Therefore, the notion of tight glycaemic control that became a standard of care for critically ill patients and was shown to significantly reduce mortality and complications, was applied in cardiac surgical patients [13]. While there has been a consensus regarding the importance of glycaemic control following cardiac surgery, there has been no agreement regarding the degree of BG control that will be associated with improved outcomes and safety [2–4].
The STS guidelines recommend the maintenance of BG below 180 mg/dl for all patients following cardiac surgery, regardless of their diabetic status [7]. The recommendation is based on data that associated glycaemic control with reduced perioperative mortality and morbidity, and more specifically less infections and shorter length of stay. The data also pointed to improved long-term survival [7]. Similar to the STS practice guidelines, more recently published guidelines for the use of insulin infusion for the management of hyperglycaemia in critically ill patients recommended glucose control using somewhat the same target range [11].
The study cohort that was used here comprised two different eras in our patient management after cardiac surgery, the group with the strict protocol (80–110 mg/dl) that was treated a full 1 year prior to the completion of the randomized controlled study, and the group that was treated with the more liberal approach for a full year right after the study was completed and analysed [8]. The transition between a study environment to everyday practice is not always smooth and often would result in different outcomes compared with the very controlled study population. In our case, the transition to the more liberal glycaemic control was shown to be safe and effective through the first 12 months postoperatively. We are encouraged by these findings as we had concerns related to the strict glycaemic control published in the NICE-SUGAR trial [14]. Our current glycaemic control allows the more liberal range (120–180 mg/dl) and is well within the therapeutic range recommended by the STS, the guidelines that were published by the American College of Physicians and the recent critical care medicine guidelines [7, 11, 15].
Limitations
One limitation of this study is that it was conducted retrospectively and was not a prospective randomized controlled study. Even with a large sample size and the use of PSM to simulate the effect of randomization, these techniques are not a replacement for a randomized study with even distribution of measured and unmeasured characteristics between the groups. However, it is encouraging that the results of the present study taken from everyday practice are in agreement with the results from our previous non-inferiority RCT on strict versus liberal glucose control. We also cannot rule out the possibility that the comparability of outcomes between the cohort groups could be the result of a combination of quality measures that occurred between the two cohort time frames. Specific quality initiatives are not accounted for in these analyses, but results did indicate that the implementation of the liberal glucose target range was not associated with significant worsening in outcomes.
Another limitation of this study could be the generalizability of these findings. Our centre performs 800–1000 cardiac operations each year, and practices rigorous blood and glucose management procedures. It is possible that these findings may not be generalizable to centres that perform fewer cases or have a fewer staff.
CONCLUSIONS
In this study, using a robust propensity score matched analysis, we showed that the implementation of a more liberal glycaemic control of 120–180 mg/dl into clinical practice was not associated with increased morbidity and had the same 1-year survival when compared with a strict regimen. The findings were consistent both in diabetic and non-diabetic patients. There was a significantly higher rate of moderate hypoglycaemic events of BG <70 mg/dl, in the strict glucose control cohort, which did not have a direct impact on morbidity in this study, but should be watched carefully. The present results confirm our prior findings that a more liberal glycaemic control strategy to maintain BG is equal to a stricter target range for perioperative outcome. These findings are significant for patient care and demonstrate the safety and efficacy of practice change for all patients following a successful randomized controlled study.
Conflict of interest: Niv Ad is a consultant and speaker for AtriCure® Inc. (West Chester, OH, USA) and Medtronic, Inc. (Minneapolis, MN, USA). The other authors declare no conflict of interest.
REFERENCES
- Gale SC, Sicoutris C, Reilly PM, Schwab CW, Gracias VH. Poor glycemic control is associated with increased mortality in critically ill trauma patients. Am Surg 2007;73:454–60.
- McDonnell ME, Alexanian SM, Junqueira A, Cabral H, Lazar HL. Relevance of the Surgical Care Improvement Project on glycemic control in patients undergoing cardiac surgery who receive continuous insulin infusions. JThorac Cardiovasc Surg 2013;145:590–4; discussion 95–7.
- Bhamidipati CM, LaPar DJ, Stukenborg GJ, Morrison CC, Kern JA, Kron ILet al. Superiority of moderate control of hyperglycemia to tight control inpatients undergoing coronary artery bypass grafting. J Thorac CardiovascSurg 2011;141:543–51.
- Lazar HL, McDonnell MM, Chipkin S, Fitzgerald C, Bliss C, Cabral H. Effects of aggressive versus moderate glycemic control on clinical outcomes in diabetic coronary artery bypass graft patients. Ann Surg 2011;254:458–63;discussion 63–4.
- Furnary AP, Wu Y. Clinical effects of hyperglycemia in the cardiac surgery population: the Portland Diabetic Project. Endocr Pract 2006;12(Suppl 3):22–6.
- Ingels C, Debaveye Y, Milants I, Buelens E, Peeraer A, Devriendt Yet al. Strict blood glucose control with insulin during intensive care after cardiac surgery: impact on 4-years survival, dependency on medical care, and quality-of-life. Eur Heart J 2006;27:2716–24.
- Lazar HL, McDonnell M, Chipkin SR, Furnary AP, Engelman RM, Sadhu ARet al. The Society of Thoracic Surgeons practice guideline series: blood glucose management during adult cardiac surgery. Ann Thorac Surg 2009;87:663–9.
- Desai SP, Henry LL, Holmes SD, Hunt SL, Martin CT, Hebsur Set al. Strict versus liberal target range for perioperative glucose in patients undergoing coronary artery bypass grafting: a prospective randomized controlled trial. J Thorac Cardiovasc Surg 2012;143:318–25.
- Davidson PC, Steed RD, Bode BW. Glucommander: a computer-directed intravenous insulin system shown to be safe, simple, and effective in 120 618 h of operation. Diabetes Care 2005;28:2418–23.
- Arabi YM, Tamim HM, Rishu AH. Hypoglycemia with intensive insulin therapy in critically ill patients: predisposing factors and association with mortality. Crit Care Med 2009;37:2536–44.
- Jacobi J, Bircher N, Krinsley J, Agus M, Braithwaite SS, Deutschman Cet al. Guidelines for the use of an insulin infusion for the management of hyperglycemia in critically ill patients. Crit Care Med 2012;40:3251–76.
- Furnary AP. Clinical benefits of tight glycaemic control: focus on the peri-operative setting. Best Pract Res Clin Anaesthesiol 2009;23:411–20.
- van den Berghe G, Wouters P, Weekers F, Verwaest C, Bruyninckx F, SchetzMet al. Intensive insulin therapy in critically ill patients. N Engl J Med2001;345:1359–67.
- Finfer S, Chittock DR, Su SY, Blair D, Foster D, Dhingra Vet al. Intensive versus conventional glucose control in critically ill patients. N Engl J Med2009;360:1283–97.
- Qaseem A, Humphrey LL, Chou R, Snow V, Shekelle P. Use of intensive insulin therapy for the management of glycemic control in hospitalized patients: a clinical practice guideline from the American College of Physicians. Ann Intern Med 2011;154:260–7.
APPENDIX. CONFERENCE DISCUSSION
Dr J. Takkenberg (Rotterdam, Netherlands): I think your study is clinically very relevant because you did not stop after your randomized controlled trial in CABG patients, but you tested where your hypothesis also works in real life. But in real life, you also included other cardiac surgery groups such as valve surgery patients and patients undergoing Cox maze. And I noticed that you did a subgroup analysis in the patients with diabetes, but would it be interesting to also do it for valve surgery and Cox maze patients? To take a look at their outcomes and how, for example, not only the outcomes, but also the incidence of renal failure may be explained by those groups? That’s my first question.
Dr Ad: Maybe it wasn’t clear enough, but the initial study was only for CABG. In this study, however, we also included valve surgery and Cox maze patients. So basically half are non-CABG patients.
Dr Takkenberg: Yes. But what you are doing is you’re extending your randomized control trial, and now you do it in real life, so you have a cohort study, and you also include valve surgery and Cox maze. And I wonder whether there may be clues in the valve surgery group and in the Cox maze group as to whether there is a higher incidence of renal failure in strict glycaemic control versus more liberal control. That’s what I mean. Did you do a subanalysis, like you did for diabetic patients, for your valve surgery and Cox maze patients also?
Dr Ad: I think that is a good point. But we know the data related to the study, and I think that, generally speaking, it’s going to show that there is no difference. I’m not so sure what is going to happen with renal failure, because we may be underpowered for this variable. But in our practice when we do so many valves and Cox mazes, we don’t really see significant differences between the groups. The CABGs are becoming a very sick population because of the multiple stenting and the delayed timing of surgery. Sometimes we can even say that our CABG population is sicker than the other one.
Dr Takkenberg: And then I have another question about the measurements you did looking at glucose levels. And I wondered whether you took a look at the variability of glucose levels in patients to see if that would be a predictor of renal failure, for example.
Dr Ad: That’s another good point, so I will explain this one. When we looked into the renal failure, we were completely surprised because in the SLIP study, we didn’t find it. So we tried to look into a potential explanation. Now, this Glucommander system is actually amazing. The variability along the hospital stay is very minimal, as also mentioned in other studies. Surveying the literature about critical care medicine and so on and so forth, we came across the association of hypoglycaemia with interferon and insulin drips, and this is why we went back and looked into the incidence of hypoglycaemia less than 70 mg%. And variability, when you don’t design it to begin with, it would be very hard to retrieve data, which is one of the limitations of a retrospective study, although it is not impossible to look at variability over 60 or 70 sticks per stay and make sense out of it. But I think it’s actually a good idea for another study for us.
Dr Takkenberg: Yes. I would take that into account next time. It is analogous to what we see with INRs in patients who are under anticoagulation. It is not as much as the target that you’re aiming for, but the variability that you observe in these patients in the measurement.
Dr Ad: Yes. It is easier to manage patients with this more liberal range. It is fewer sticks per patient, so the patients are happier. That’s two sticks a day. And I can give you the numbers for the manpower and the hours of labour and tests, so it is a significant cost saving. And maybe, maybe we are really onto something here because there is some association between hypoglycaemia and renal failure. But the main focus here is that we were, at least in my mind, able to transition from a randomized control study to a clinical setup and actually say, hey, it also works in a nonstudy setup, which is way more controlled. And that’s the way I look at it.
Dr Takkenberg: Well, I completely agree with you, but the fun thing about research is that you always find new things to go after. And I think this renal failure may be an important one. I have one final comment, if you allow me. You give the impression in your paper that propensity score matching is almost as good as randomizing patients, but in fact it’s not because it only corrects for those factors that you put into the model, and any unknown relevant factors are not corrected for. And you can see there are still slight differences in your population. And I was wondering why you chose the approach of propensity score matching. Why did you not make a multivariable model and put in your propensity score?
Dr Ad: Well, I think that there are two ways to look at it. But when you get to this number of patients, propensity match analysis is a really strong method that actually puts you in a strong Level B of evidence and a potential for a IIa indication, if we come to some type of conclusion. So it’s always superior to a regular multivariable analysis when you get to a strong propensity matching. Because we have to understand, I mean, I’m not teaching anybody statistics, but in propensity matching analysis, basically you simulate another variable. The propensity matching is similar to one more variable in multivariable analysis, which is, this is what we do.
Dr Takkenberg: Well, I do teach statistics. I know that multivariable analysis, putting your propensity score into that is, in principle, better, as long as you get a nice balance. And your propensity score becomes insignificant in your multivariable model, and you utilize your whole data sets, your entire experience. Now, of course, you have some selection there because you take out of both groups, you take out the outliers; but I can understand from a practical point of view. But I was wondering whether you had considered doing so anyway.
Dr Ad: We submit a paper, and if this would be a requirement, we’ll do so. But I think that based on our experience, and we have a very extensive experience, the matching is excellent. And, yes, you have outliers here and there, but do we really have interesting outliers? And that’s the question. Now, I personally don’t have interest in the outliers, because when we do the programme, we really want to understand what’s going on with the patient.