![]()
Presentation
American Association of Clinical Endocrinologists Scientific & Clinical Congress
Date
May 2017
Authors
Joseph Aloi,1 Jagdeesh Ullal,2,3 Paul Chidester,3 Raymie McFarland4
BACKGROUND
Hyperglycemia affects 30-40% of hospitalized patients and can be linked to poor outcomes, including increased mortality, longer length of hospitalization, surgical site infections and increased readmissions. The standard of care in non-critical patients is subcutaneous (SubQ) basal bolus insulin therapy (BBI). Despite AACE guideline recommendations, best practice education and new BBI order sets, there is a persistence of sliding scale insulin (SSI) use at many hospitals. There are many barriers to adopting best practices, including lack of diabetes and endocrinology management expertise. The eGlycemic Management System® (eGMS®) was studied to facilitate the adoption of BBI.
METHODS
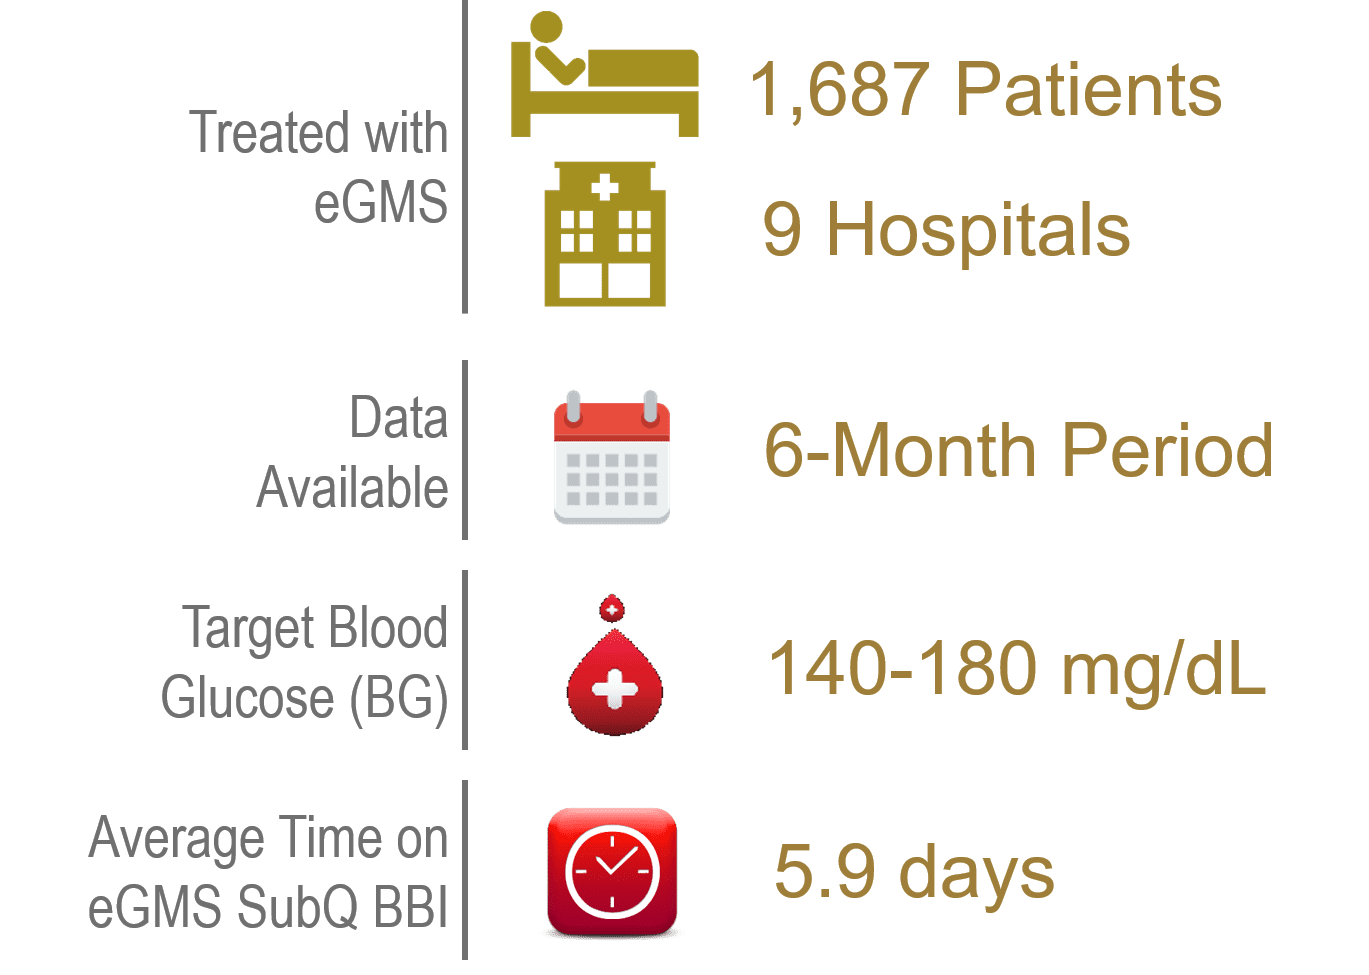
This retrospective quality improvement study analyzed hyperglycemia rates for patients needing SubQ basal bolus insulin managed with eGMS. 1,687 patients at 9 hospitals treated with eGMS had data available over a 6-month interval. The target blood glucose (BG) was set at 140-180 mg/dL. Inclusion criteria: non-ICU patients with an admission BG of 140-400 mg/dL.
This study compared average daily BGs on admission and discharge, including breakfast, lunch, dinner and bedtime. Safety was measured by the percent of patient days with mild to moderate hypoglycemia (<70 mg/dL), severe hypoglycemia (<40 mg/dL), and hyperglycemia (>250 mg/dL).
PATIENT DEMOGRAPHICS
| #Patients | 1,687 |
|---|---|
| Age (SD) | 63.01 (15.05) |
| Gender – Male | 44.90% |
| Gender – Female | 55.10% |
| Height (SD) | 167.20 (9.01) |
| Weight (SD) | 87.59 (18.97) |
| BMI (SD) | 30.86 (6.58) |
| Length of Stay | 158.92 Hours |
| A1c (SD) | 8.81 (2.35) |
| GFR (SD) | 66.68 (23.01) |
RESULTS
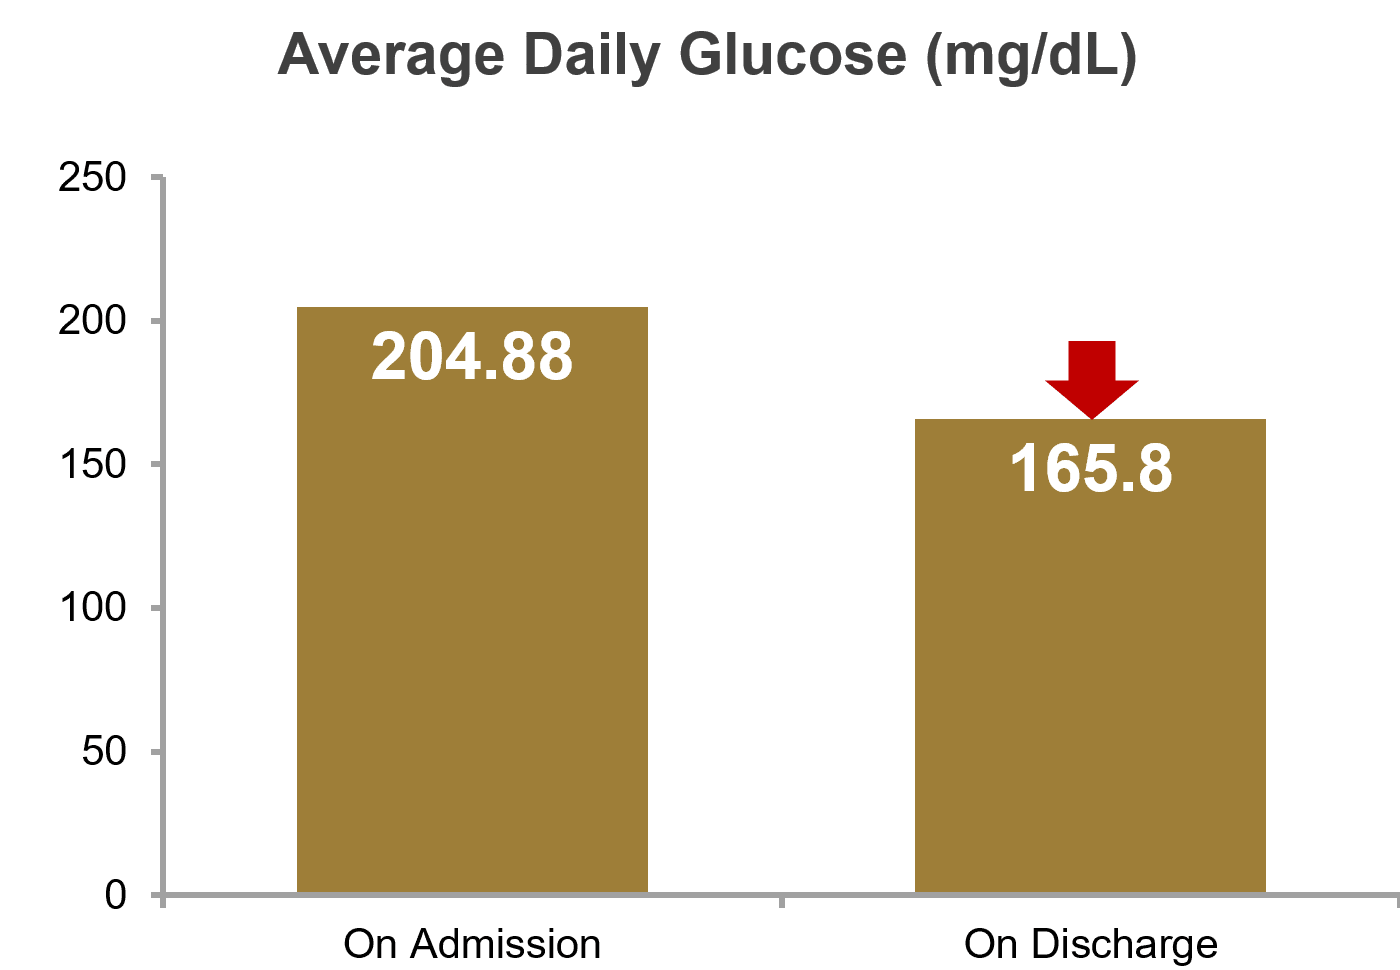
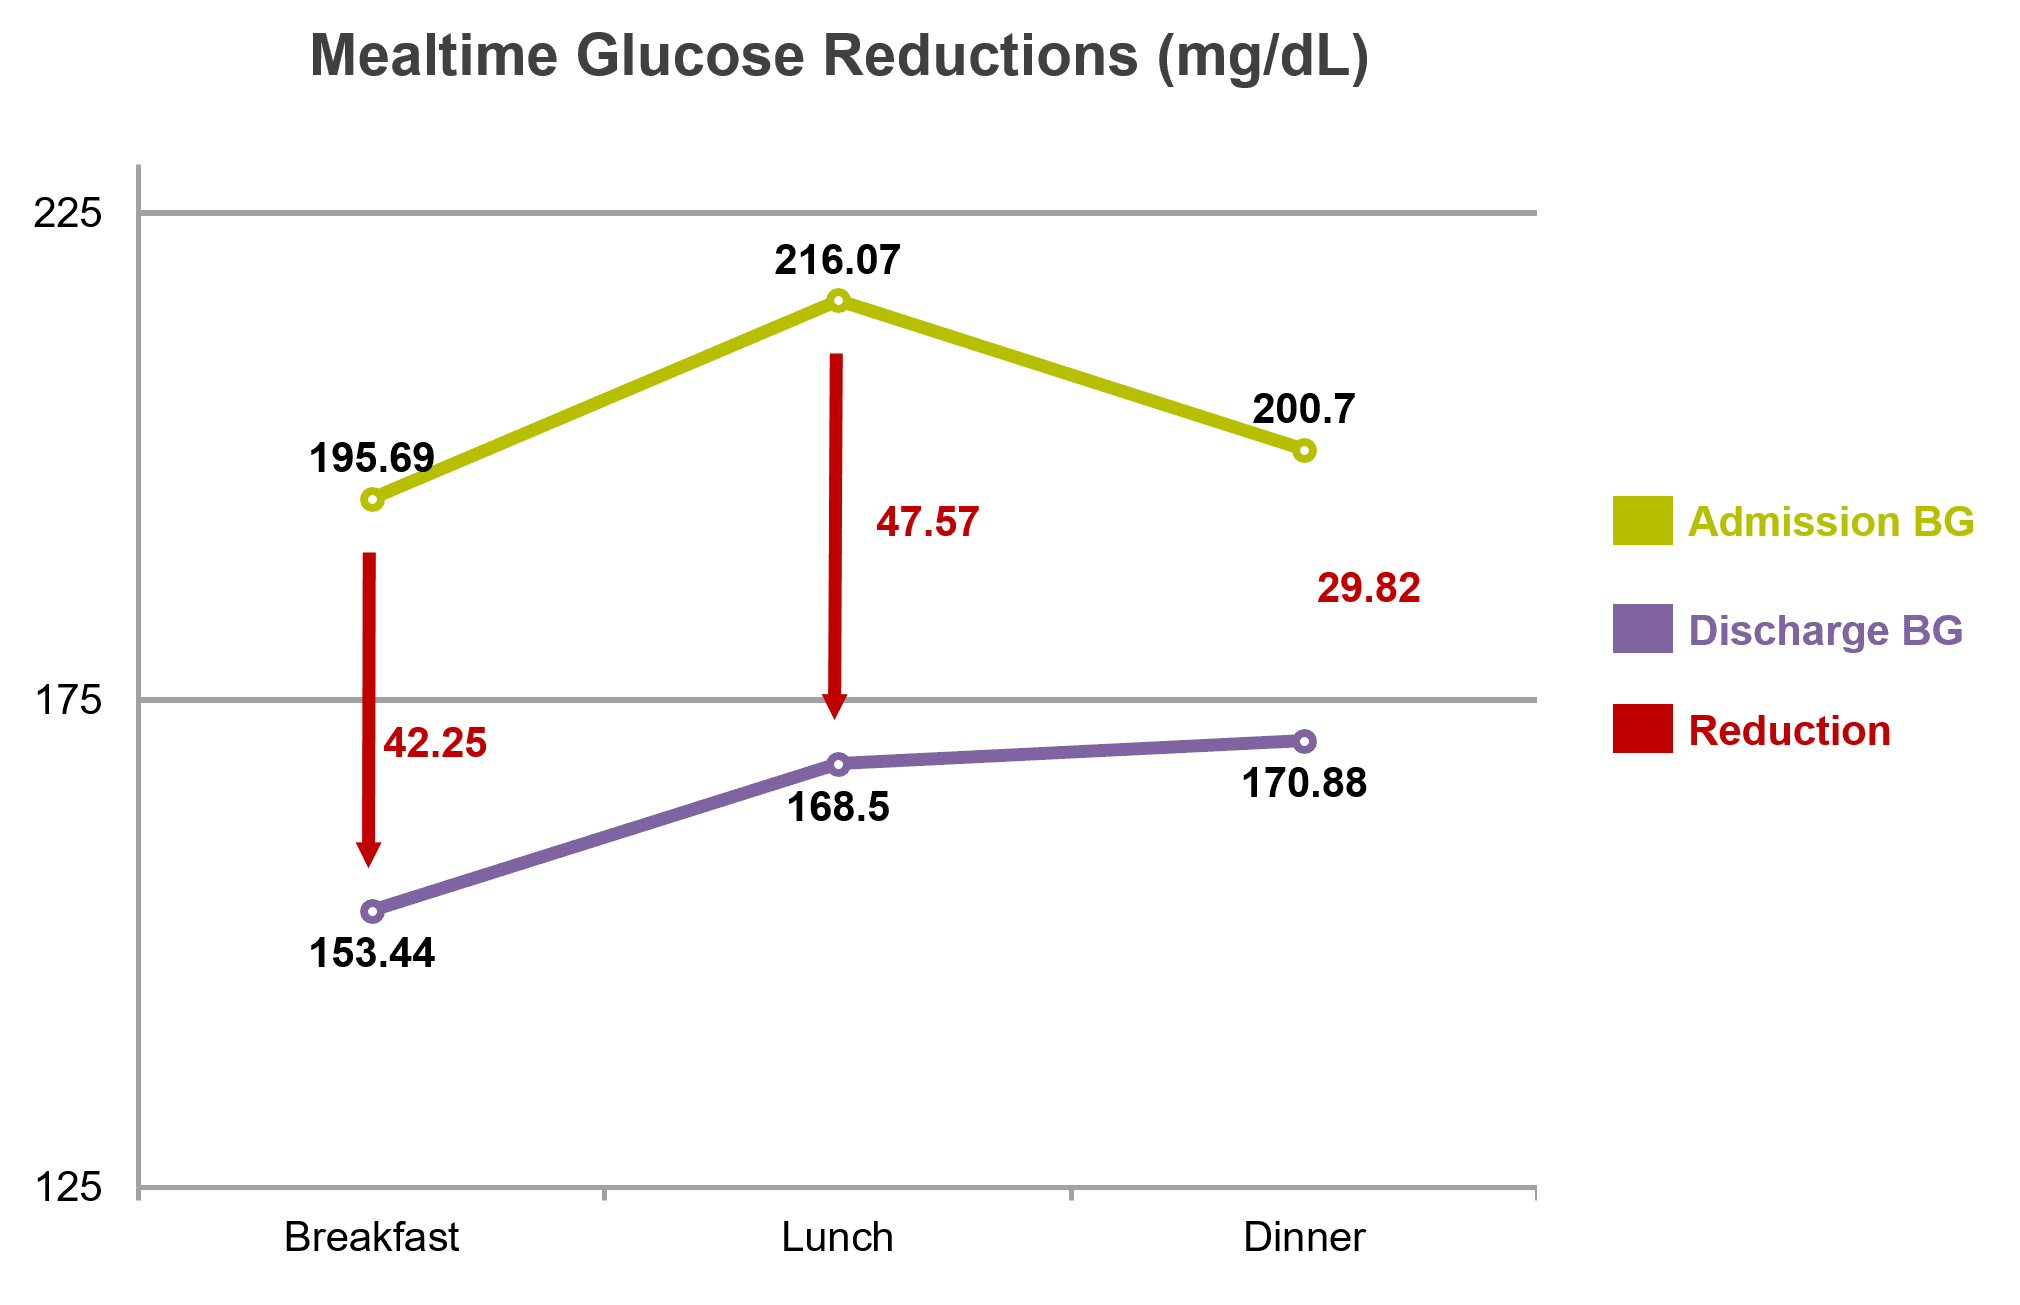
Average daily BG was 204.88 mg/dL on admission and 165.80 mg/dL on discharge, for a reduction of 39.08 mg/dL. At breakfast, average daily BG was 195.69 mg/dL on admission and 153.44 mg/dL on discharge, for a reduction of 42.25 mg/dL; at lunch, 216.07 mg/dL on admission and 168.50 mg/dL on discharge, for a reduction of 47.57 mg/dL; and at dinner, 200.70 mg/dL on admission and 170.88 mg/dL on discharge, for a reduction of 29.82 mg/dL. Percent of patient days with mild to moderate hypoglycemia (<70 mg/dL) was 0.08%, severe hypoglycemia (<40mg/dL) was 0.0%, and hyperglycemia (>250 mg/dL) was 11.29%. Average time on eGMS SubQ was 5.9 days.
| Avg Admission BG | 204.88 mg/dL |
|---|---|
| Avg Discharge BG | 165.80 mg/dL |
| Avg BG Reduction | 39.08 mg/dL |
| Avg BG Reduction (%) | 19% |
| Hypoglycemia <70 mg/dL | 0.08% |
| Hypoglycemia <40 mg/dL | 0.00% |
| Hyperglycemia >250 mg/dL | 11.29% |
| Avg Time on eGMS SubQ | 5.9 Days |
| Basal Doses Adjusted | 84% of Days |
| Bolus Doses Adjusted | 100% of Days |
| Correction Doses Adjusted | 100% of Days |
CONCLUSION
Hospital prescribers using eGMS to titrate patients’ SubQ BBI regimen achieved the prescribed glycemic target of 140‑180 mg/dL at breakfast, lunch, dinner and bedtime, with low incidence of mild to moderate hypoglycemia (0.08% at <70 mg/dL) and no severe hypoglycemia (0.0% at <40 mg/dL). The average daily blood glucose was reduced 19% from admission to discharge over ~6 days of insulin management. These results suggest eGMS can maintain glucose control within the recommended glucose targets without increased risk of hypoglycemia, and enable prescribers to effectively displace SSI with BBI.
Affiliations
- Wake Forest Baptist Health, Winston-Salem, North Carolina.
- Eastern Virginia Medical School, Norfolk, Virginia.
- Sentara Healthcare, Norfolk, Virginia.
- Glytec, Greenville, South Carolina and Waltham, Massachusetts.