![]()
Publication
Journal of Hospital Medicine
Date
October 2010
Authors
Christopher Newton,1 Dawn Smiley,1 Bruce Bode,2 Abbas Kitabchi,3 Paul Davidson,2 Sol Jacobs,1 R Dennis Steed,5 Frankie Stentz,3 Limin Peng,4 Patrick Mulligan,1 Amado Freire,3 Angel Temponi,1 Guillermo Umpierrez1
ABSTRACT
Purpose: To compare the safety and efficacy of continuous insulin infusion (CII) via a computer-guided and a standard paper form protocol in a medical intensive care unit (ICU).
Methods: Multicenter randomized trial of 153 ICU patients randomized to CII using the Glucommander (n = 77) or a standard paper protocol (n = 76). Both protocols used glulisine insulin and targeted blood glucose (BG) between 80 mg/dL and 120 mg/dL.
Results: The Glucommander resulted in a lower mean BG value (103 ± 8.8 mg/dL vs. 117 ± 16.5 mg/dL, P <0.001) and in a shorter time to reach BG target (4.8 ± 2.8 vs. 7.8 hours ± 9.1 hours, P <0.01), and once at target resulted in a higher percentage of BG readings within target (71.0 ± 17.0% vs. 51.3 ± 19.7%, P <0.001) than the standard protocol. Mean insulin infusion rate in the Glucommander was similar to the standard protocol (P = 0.12). The percentages of patients with >1 episode of BG <40 mg/dL and <60 mg/dL were 3.9% and 42.9% in the Glucommander and 5.6% and 31.9% in the standard, respectively [P = not significant (NS)]. Repeated measures analyses show that the probabilities of BG reading <40 mg/dL or <60 mg/dL were not significantly different between groups (P = 0.969, P = 0.084) after accounting for within-patient correlations with or without adjusting for time effect. There were no differences between groups in the length of hospital stay (P = 0.704), ICU stay (P = 0.145), or inhospital mortality (P = 0.561).
Conclusion: Both treatment algorithms resulted in significant improvement in glycemic control in critically ill patients in the medical ICU. The computer-based algorithm resulted in tighter glycemic control without an increased risk of hypoglycemic events compared to the standard paper protocol.
INTRODUCTION
Observational studies in hospitalized patients with and without diabetes indicate that hyperglycemia is a predictor of poor clinical outcome and mortality.1-4 Early randomized controlled trials of intensified insulin therapy in patients with surgical and medical acute critical illness reported a reduction on the risk of multiorgan failure and systemic infections,3-5 as well as short- and long-term mortality.1,4 Recent randomized controlled trials, however, have failed to confirm the previously suggested benefits of intensive glucose control,6 and the large multicenter normoglycaemia in intensive care evaluation and survival using glucose algorithm regulation (NICE-SUGAR) study reported an absolute increase in mortality rate with intensive glucose control.7 In addition, intensified insulin therapy in critically-ill patients has been shown to be associated with a higher rate of severe hypoglycemic events than less aggressive glycemic control protocols.7-10 These results have led to a heightened interest in improving the quality and safety of the management of diabetes and hyperglycemia in the hospital.
The use of intravenous continuous insulin infusion (CII) is the preferred route of insulin administration for the management of hyperglycemia in the critical care setting.1,11 Numerous examples of successful CII algorithms in achieving glycemic control are reported in the literature.4,5,12 Traditionally, order forms to “titrate drip” to achieve a target blood glucose (BG) range using an established algorithm or by the application of mathematical rules have been used in clinical practice. Recently, computer-based algorithms aiming to direct the nursing staff adjusting insulin infusion rate have become commercially available.13,14 It is not known, however, if computer-based algorithms are superior to standard paper form-based protocols in achieving glucose control and in reducing hypoglycemic events in critically-ill patients. Accordingly, this multicenter randomized study aimed to determine differences in glycemic control and hypoglycemic events between treatment with a computer-guided CII device and a standard column-based paper algorithm in critically-ill patients in the medical intensive care unit (ICU).
RESEARCH DESIGN AND METHODS
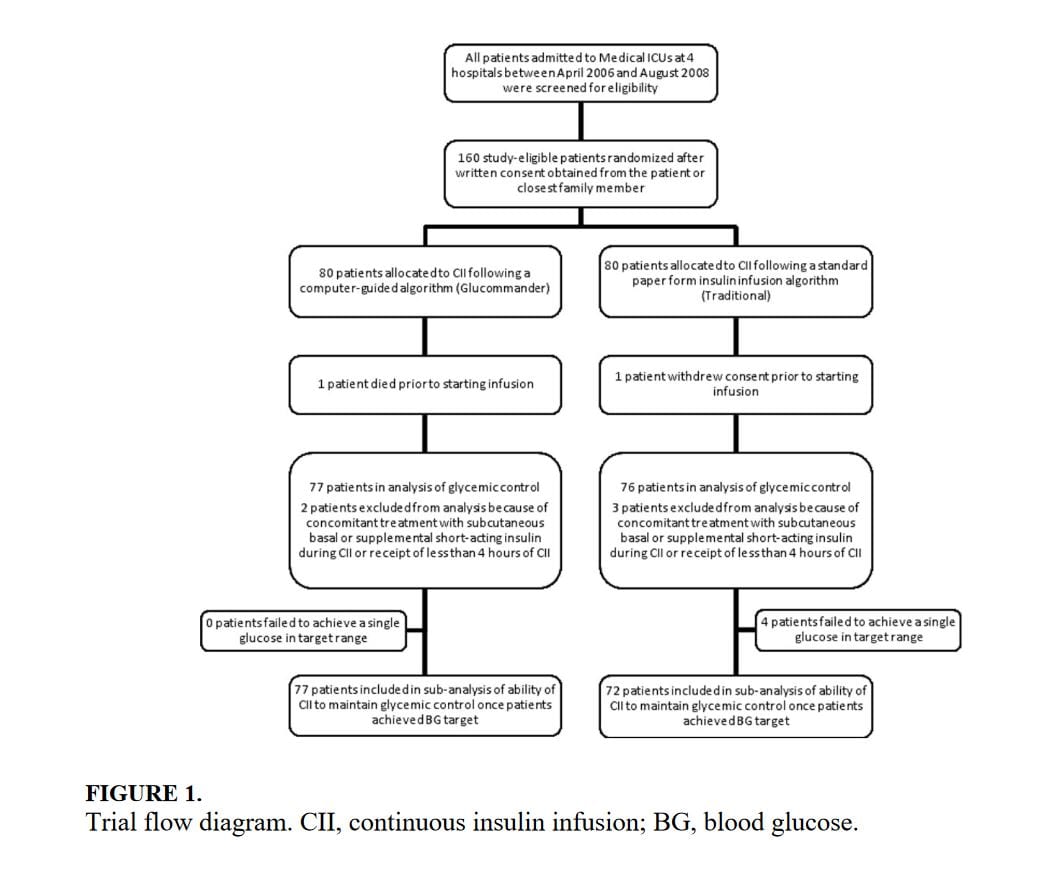
In this multicenter, prospective, open-label randomized study, 160 adult patients admitted to a medical ICU with new hyperglycemia or with a known history of diabetes treated with diet, insulin therapy or with any combination of oral antidiabetic agents were enrolled after written informed consent had been obtained from the patient or closest family member (Figure 1). Patients with known history of diabetes had >2 BG readings >120 mg/dL while subjects without a history of diabetes had >2 BG readings >140 mg/dL prior to enrollment. We excluded patients with acute hyperglycemic crises such as diabetic ketoacidosis (DKA) and hyperosmolar hyperglycemic state,15 patients with severely impaired renal function (serum creatinine >3.5 mg/dL), dementia, and pregnancy. This study was conducted at 4 hospital centers including Grady Memorial Hospital, Emory University Hospital, and Piedmont Hospital in Atlanta, Georgia and the Regional Medical Center in Memphis, Tennessee.
Patients were randomized using a computer randomization table to receive CII following a computer-guided algorithm (Glucommander) or CII following a standard paper form insulin infusion algorithm. Both protocols used glulisine (Apidra) insulin and targeted a BG between 80 mg/dL and 120 mg/dL. Insulin management was directed by the specific assigned protocol and was carried out daily by the nursing staff and by members of the internal medicine residency program. The ICU physician and primary care team decided on the treatment for all other medical problem(s) for which patients were admitted. Data were collected during CII up to the first 10 days of ICU stay.
STANDARD AND COMPUTER-BASED CII ALGORITHMS
The standard paper algorithm was adapted from a protocol initially published by Markovitz et al.16 (Supporting Information Appendix). The algorithm is divided into four columns based on empirically determined insulin sensitivity. The first algorithm column was for the most insulin-sensitive patients, and the fourth algorithm column was for the most insulin resistant patients. The majority of patients started in the algorithm 1 column. Insulin resistant patients, such as those receiving glucocorticoids or receiving >80 units of insulin per day as outpatients, started in the algorithm 2 column. The insulin infusion rate was determined by the patient’s BG level and was measured hourly until the patient was stable and within the target range. If BG targets were not achieved and the BG had not decreased by at least 60 mg/dL in the preceding hour, the patient was moved to the next column. The characteristics and use of the Glucommander algorithm have been reported previously.13 In brief, this computer-guided insulin algorithm directs the administration of intravenous insulin in response to BG measurement at the patient’s bedside. In this study, the Glucommander program was loaded into a PalmOne (Zire 31, Tungsten E2 by Palm Inc.) handheld personal digital assistant (PDA) device. During the infusion, the nurse entered BG levels into the system and the computer recommended the insulin infusion rate and a variable time to check the next glucose testing. An alarm prompted the scheduled glucose check. The insulin infusion followed the formula: Insulin/Hour = Multiplier × (BG – 60). The initial multiplier or insulin sensitivity factor was 0.02. The Glucommander was programmed to adjust the multiplier to achieve and maintain target glucose.
Prior to the beginning of the study, the nursing staff at all institutions was instructed on the use of the Glucommander and paper form protocol. The insulin drip adjustment was carried out by ICU nurses in each hospital. Study investigators and coordinators rounded daily on study patients and were available for consultation and collecting data but were not involved in insulin adjustment based on the protocol.
Clinical Outcome Measures – The primary outcome of the study was to determine differences in glycemic control as measured by mean daily BG concentration between treatment groups. Secondary outcomes include differences between groups in number of hypoglycemic events (BG <60 mg/dL and <40 mg/dL), time to first glucose in target range, amount of insulin treatment (units/kg/hour), number and frequency of glucose measurements, length of stay (LOS) in the ICU and hospital, number of hyperglycemic episodes (BG >200 mg/dL), and mortality rate.
BG Monitoring – Capillary BG measurement in the standard paper protocol was performed hourly until it was within goal range for 4 hours and then every 2 hours for the duration of the infusion. Glucose measurements in the Glucommander arm were requested by the device at intervals that ranged from 20 minutes to 2 hours. The Glucommander software determined the interval between measurements based on the stability of the BG levels of the patient. The insulin infusion rate adjustment was based on the current glucose value and the slope of the glucose curve. The Glucommander alarmed at the appropriate interval to remind the nurse to check and enter the new BG value. If the BG was decreasing faster than expected, the program called for repeat BG measurements more frequently for insulin drip adjustment. If the BG was within target range for 4 consecutive readings, the Glucommander alarmed for repeat BG every 2 hours.
Laboratory Assays – Plasma glucose and glycosylated hemoglobin (HbA1c) were measured on admission. Complete blood count and complete metabolic profile were measured on admission and as otherwise determined by the treating physician.
Statistical Analysis – All data in the text, table and figures are expressed as mean ± standard deviation. Comparison between groups was carried out by nonparametric two sample Wilcoxon tests for continuous variables and chi-square tests (or Fisher’s exact tests) for categorical variables. Cochran-Mantel-Haenszel (CMH) or CMH exact tests were further used to adjust for site difference. Repeated measures analyses were conducted to model the probability of BG <60 mg/dL or BG <40 mg/dL based on generalized linear model with AR(1) within-subject correlation structure. A P value <0.05 is considered as significant. We expected differences in mean BG concentration >30 mg/dL between groups. Assuming 2-tailed alpha of 0.05, a standard deviation of approximately 40, and a one-to-one allocation and no subject attrition, 80 patients per treatment group were thought to be sufficient to achieve 80% power for group mean comparisons. Statistical significance was defined as a type 1 error of 0.05. Statistical analysis was performed using the SAS 9.2.
RESULTS
The admission characteristics and clinical outcomes of interest of the study patients are shown in Table 1. A total of 160 adult patients admitted to a medical ICU with new hyperglycemia (47%) or with a known history of diabetes (53%) were randomized into the study. Of them, 7 patients were excluded due to withdrawal of consent, treatment with subcutaneous basal or supplemental short-acting insulin during CII, or receiving less than 4 hours of CII. There were no differences in the mean age, gender, race, history of diabetes, or primary admitting diagnosis between treatment groups. The most common admitting diagnosis categories included pulmonary (22.1%), cardiovascular (21.4%), infectious (20.0%), and central nervous system (16.6%) disorders.
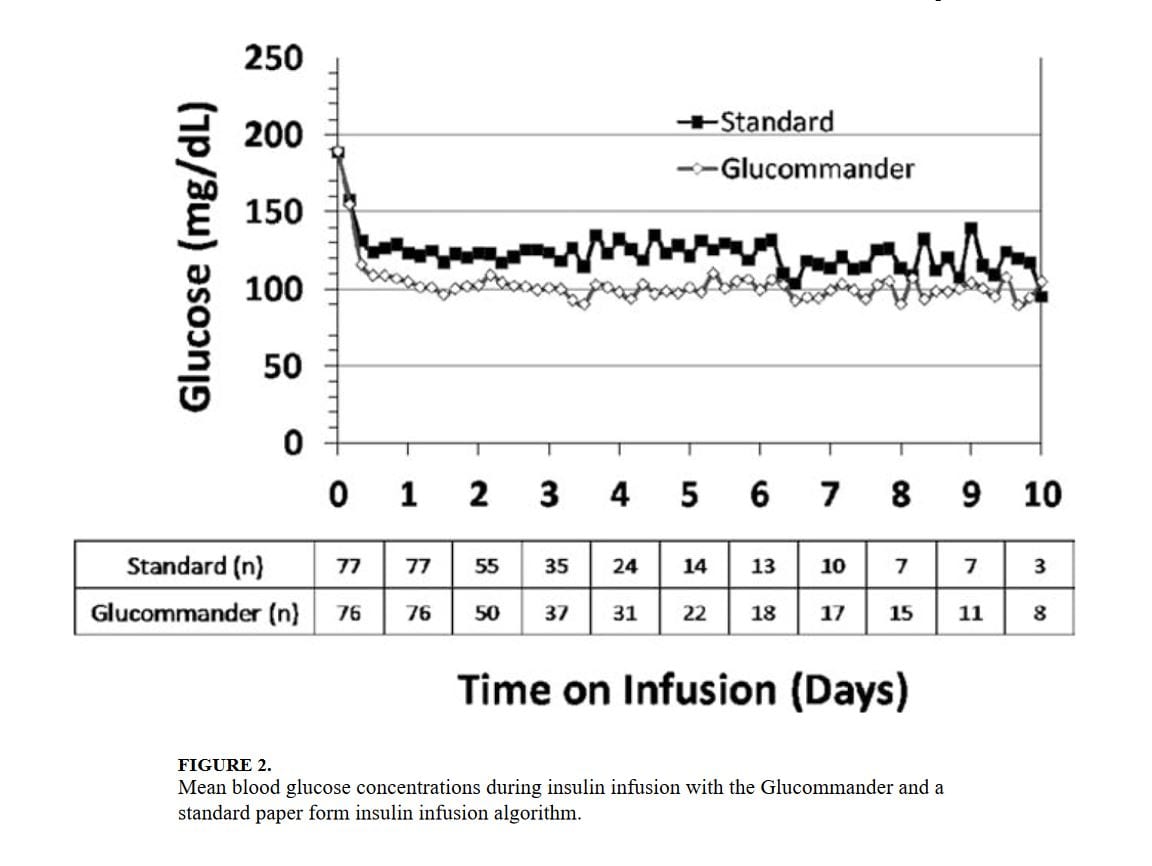
The mean admission glucose concentration for study patients was 190.6 ± 58.2 mg/dL and the mean A1C was 7.0 ± 1.7%. Glycemic control parameters achieved with the CII protocols are listed in Table 2. At the start of CII, the mean BG value was similar for the Glucommander and paper protocols (189.7 ± 64.8 mg/dL and 188.4 ± 54.8 mg/dL, P = 0.419). The mean time to reach the BG target was shorter in the Glucommander group (4.8 ± 2.8 vs. 7.8 ± 9.1 hours, P <0.001). The Glucommander group had a lower mean glucose value during insulin infusion (115.5 ± 20.7 vs. 131.0 ± 24.6 mg/dL, P <0.001) and once at target goal, in a lower mean BG values (103.3 ± 8.8 vs. 117.3 ± 16.5 mg/dL, P <0.001) than the standard algorithm (Figure 2). The mean inpatient BG difference between treatment groups was 15.5 mg/dL (P <0.001), with a mean daily BG difference ranging from 17.4 mg/dL to 24.4 mg/dL less for the Glucommander group during days 2 to 6 of therapy (P <0.01).
The Glucommander algorithm was associated with tighter glycemic control and less glucose variability than the standard paper form protocol. Once patients achieved BG target, on average 71.1% of BG readings in the Glucommander and 51.3% in the standard group remained within the 80 mg/dL to 120 mg/dL target range (P <0.001). In addition, the Glucommander was associated with a significantly lower rate of severe hyperglycemia during insulin infusion. The number of patients with 1 or more episodes of BG >200 mg/dL (11.7% vs. 25%, P = 0.057 before adjusting for potential site difference and P = 0.034 after adjusting for site difference) were less in the Glucommander group than in the standard paper regimen. In addition, 4 of these patients in spite of being on the highest insulin delivery column failed to achieve glucoses <180 and had an average in-hospital glucose level of 204.5 ± 32.2 mg/dL. These patients were transitioned to the Glucommander arm and withdrawn from the study. All episodes of hypoglycemia occurred after the patients achieved >1 glucose measurement within the target range. The number of patients who experienced one or more BG <40 mg/dL and <60 mg/dL was 3.9% and 42.9% in the Glucommander and 5.6% and 31.9% in the standard regimen, respectively (both, P = not significant [NS]). Similar results were obtained when site effect was accommodated (both, P = NS). Based on repeated measures analyses, the probabilities of BG reading <40 mg/dL or <60 mg/dL were not significantly different between groups (P = 0.969, P = 0.084) after accounting for within-patient correlations with or without adjusting for time effect. None of these episodes resulted in seizures or were otherwise judged to be associated with deterioration of clinical status.
The mean insulin infusion rate was slightly higher in the Glucommander regimen but the difference was not statistically significant between groups. Patients treated with the Glucommander protocol received a mean infusion rate of 0.035 ± 0.024 unit/kg/hour for a total of 2.85 ± 1.93 units per hour, and those treated with the paper protocol received a 0.028 ± 0.021 units/kg/hour for a total of 2.50 ± 2.28 units per hour, P = 0.12 and P = 0.09, respectively.
The numbers of BG measurements were similar between the Glucommander and standard paper algorithms (44.2 ± 39.8 and 41.2 ± 34.5 respectively, P = NS) with the number of glucose testing per patient ranging from 6 to 175 in the Glucommander and 3 to 168 in the standard group. Similarly, when normalized to the duration of insulin infusion, the frequency of BG monitoring was not different with the protocols (0.68 ± 0.18 and 0.62 ± 0.22 tests/hour respectively, P = NS).
Compared to the standard paper insulin infusion algorithm, patients treated with the Glucommander device had a similar mean ICU LOS (13.4 ± 13.8 vs. 8.5 ± 7.6 days, P =0.145), mean hospital LOS (17.5 ± 15.0 days vs. 23.9 ± 26.3 days, P = 0.704) and hospital mortality (26.0% vs. 21.9%, P = 0.561).
Table 1. Patient Characteristics and Clinical Outcomes with the CII Protocols
| Glucommander (#Patients=77) |
Standard (#Patients=76) |
P Value | |
|---|---|---|---|
| Age (years) | 57.8 ± 11.0 | 58.5 ± 13.4 | NS |
| Gender (M/F), % | 57.1/42.9 | 51.3/46.7 | NS |
| Race (W/B/H), % | 25.0/69.6/1.0 | 28.9/67.3/3.9 | NS |
| BMI (kg/m2) | 31.6 ± 10.4 | 30.5 ± 8.1 | NS |
| Primary Admitting Diagnosis | |||
| Cardiovascular, % | 24.7 | 18.1 | NS |
| Pulmonary, % | 24.7 | 19.4 | NS |
| Infection, % | 16.4 | 23.6 | NS |
| Cerebrovascular, % | 4.1 | 4.2 | NS |
| Renal, % | 1.4 | 1.4 | NS |
| Apache Score | 13.4 ± 6.1 | 16.0 ± 8.3 | NS |
| History of Diabetes, % | 53.3 | 54.3 | NS |
| Hemoglobin A1c (%) | 7.2 ± 1.9 | 6.8 ± 1.4 | NS |
| DM Patients | 7.9 ± 2.2 | 7.3 ± 1.6 | NS |
| Non-DM Patients | 6.2 ± 0.7 | 6.0 ± 0.7 | NS |
Table 2. Characteristics of Insulin Administration and Glycemia with the CII Protocols
| Glucommander (#Patients=77) |
Standard (#Patients=76) |
Mean Difference (CI) or P Value |
|
|---|---|---|---|
| Initial Glucose (mg/dL) | 189.7 ± 64.8 | 188.3 ± 54.8 | 1.333 (-17.701, 20.367) |
| Median (Range) Duration of CII (hours) |
46 (12-240) | 47 (5-240) | -12.939 (-34.630, 8,752) |
| Insulin Infusion Rate (units/kg/hour) |
0.035 ± 0.024 | 0.028 ± 0.021 | 0.006 (-0.002, 0.014) |
| Time to Achieve Target BG of 80-120 mg/dL (hours) |
4.9 ± 2.8 | 7.8 ± 9.1 | -3.0 (-5.2, -0.9) |
| Mean BG Maintained Once Target Achieved (mg/dL) |
103.3 ± 8.8 | 117.3 ± 16.5 | -14.0 (-18.210, -9.774) |
| % of BG Tests Within Target Range |
71.0 ± 17.0% | 51.3 ± 19.7% | 19.6 (13.7, 25.5) |
| Mild Hypoglycemia, <60 mg/dL, n (% patients) |
33 (42.9) | 23 (31.9) | NS |
| Severe Hypoglycemia, <40 mg/dL, n (% patients) | 3 (3.9) | 4 (5.6) | NS |
| Hyperglycemia, >200 mg/dL, n (% patients) | 9 (11.7) | 18 (25.0) | 0.054 |
DISCUSSION
This study is the first to compare the safety and efficacy of a CII via a computer-guided algorithm and a standard paper form protocol in nonsurgical patients in the ICU. Both Treatment algorithms resulted in significant improvement in glycemic control with the Glucommander achieving glycemic glucose target in a shorter time of treatment, a lower mean glucose concentration, and in greater percentage of glucose measurements maintained within target range, without an increased risk of severe hypoglycemia compared to the standard paper protocol.
Hyperglycemia in hospitalized patients is a common, serious, and costly health care problem. Evidence from observational and interventional studies indicate that hyperglycemia in critical illness is associated with an increased risk of complications and mortality.2-5 There is ongoing debate, however, about the optimal glucose level in hospitalized patients with critical illness. Although, several cohort studies as well as early randomized trials in ICU patients reported that intensified insulin treatment to achieve a target glucose between 80 mg/dL to 110 mg/dL reported a reduction in short-term and long-term mortality and rates of multiorgan failure and systemic infections compared with conventionally treated patients.3,4,17 More recent randomized controlled trials and metaanalyses, however, have shown that this low BG target has been difficult to achieve without increasing the risk for severe hypoglycemia.7-10 In addition, recent multicenter trials have failed to show significant improvement in clinical outcome or have even shown increased mortality risk with intensive glycemic control.6-10 Based on these reports, the American Association of Clinical Endocrinologist (AACE) and American Diabetes Association (ADA) task force on inpatient glycemic control recommended different glycemic targets in the ICU setting. Current guidelines suggest targeting a BG level between 140 mg/dL and 180 mg/dL (7.8 and 10.0 mmol/L) for the majority of ICU patients and a lower glucose targets between 110 mg/dL and 140 mg/dL (6.1 and 7.8 mmol/L) in selected ICU patients (i.e., centers with extensive experience and appropriate nursing support, cardiac surgical patients, patients with stable glycemic control without hypoglycemia). Glucose targets >180 mg/dL or <110 mg/dL are no longer recommended in ICU patients.
The rate of severe hypoglycemic events (<40 mg/dL) observed in both arms of our trial was significantly lower than those reported in recent international trials of intensive glycemic control.3,4,8 The overall rate of severe hypoglycemic events in international trials ranged between 5% to 28.6%.3,4,7,8,18,19 In this trial, the number of patients with severe hypoglycemia was 3.9% in the computer-based and 5.6% in the standard paper algorithm. Repeated measures analyses show the probabilities of BG readings <40 mg/dL were similar and not significantly different between groups (P = 0.969). We observed, however, a high rate of mild hypoglycemic events in patients treated with both insulin algorithms. The number of patients with BG <60 mg/dL was 42.9% in the Glucommander and 31.9% in the standard (P = NS). Minimizing the rate of hypoglycemia events is of major importance in hospitalized patients because it has been shown that hypoglycemia may be an independent risk factor of poor clinical outcome and mortality.20 Hypoglycemia may increase the risk of ventricular arrhythmias, in part due to the prolongation QT interval21 and can impair cerebral glucose metabolism resulting in brain metabolic dysfunction, as suggested by recent clinical studies.22 Moreover, insulin-induced hypoglycemia is also associated with increased proinflammatory cytokines (tumor necrosis factor [TNF]-alpha, interleukin [IL]-1beta, IL-6, and IL-8) and oxidative stress23 that correlate with elevations of counterregulatory hormones (catecholamines, cortisol).
The Glucommander was associated with lower glycemic variability and with a higher percentage of BG readings within target range than patients treated with the standard paper form regimen. The clinical importance of the degree of variability and rapidity of fluctuations in glucose levels in critically ill patients is a topic of recent interest. Glycemic variability has been identified as a strong independent contributor to the risk of mortality in critically ill and surgical patients.24 Low levels of glycemic variability (standard deviation [SD] <10 mg/dL or 10-20 mg/dL) have been shown to have a statistically significant lower risk of mortality, even after adjustment for severity of illness. Further studies are needed to determine benefits on clinical outcomes from the more consistent BG control from computer-based titration protocols.
We acknowledge the following limitations in this multi-center open label study. First, this study was conducted in the medical ICU and excluded postsurgical patients and subjects expected to undergo a major surgical procedure during the hospital stay. Although a recent meta-analysis9 of 26 studies involving 13,567 patients reported no benefits in the general ICU population, it found a favorable effect of intensive glycemic control on mortality in surgical ICU patients (relative risk [RR], 0.63; confidence interval [CI], 0.44-0.91). We also excluded patients with severe renal insufficiency and patients with a history of hyperglycemic crises. In addition, our study was not powered to demonstrate differences in mortality or clinical outcome between treatment groups, and the BG targets used in this study were lower than glycemic targets recently recommended by the AACE and ADA inpatient glycemic control task force.25 Raising the BG targets is likely to reduce or prevent the rate of mild and severe hypoglycemic events in the ICU.
In conclusion, the computer-guided algorithm resulted in a more rapid and tighter glycemic control with a similar rate of hypoglycemic events than the standard paper form protocol in medical ICU patients. Our study suggests that, both treatment algorithms are appropriate alternatives for the management of hyperglycemia in critically ill patients, and the choice depends on a physician’s preferences, cost considerations, and the availability of the computer guided algorithm. Large randomized clinical trials are needed to test the impact of the new AACE/ADA recommended BG targets in reducing hypoglycemic events, hospital complications, and hospital mortality in critically ill patients in the ICU.
AFFILIATIONS
- Department of Medicine, Emory University School of Medicine, Atlanta, Georgia.
- Atlanta Diabetes Associates, Piedmont Hospital, Atlanta, Georgia.
- University of Tennessee Health Science Center, University of Tennessee, Memphis, Tennessee.
- Rollins School of Public Health, Emory University, Atlanta, Georgia.
- Southeastern Endocrine & Diabetes, Roswell, Georgia.
DISCLOSURE
NCT registration Number: NCT#00394524. Results of this trial were presented in abstract form at the 68th Scientific Session, American Diabetes Association, San Francisco, CA, June 2008. This investigator-initiated study was supported by an unrestricted grant from sanofi-aventis. Dr. Umpierrez is supported by research grants from the American Diabetes Association (7-03-CR-35), and National Institutes of Health: U01 DK074556-01 and General Clinical Research Center (CTSA) Grant M01 RR-00039. At the time of this trial, Drs. Newton, Smiley, Bode, and Umpierrez either served on the speaker’s bureau or were paid consultants for sanofi-aventis. Drs. Bode and Davidson own stock in Glucotec, Inc. Dr. Steed has an ownership interest in Glucommander. The sponsors of the study were not involved in the study design, data collection, analysis or interpretation of the results, or preparation of the manuscript.
REFERENCES
- Clement S, Braithwaite SS, Magee MF, et al. Management of diabetes and hyperglycemia in hospitals. Diabetes Care. 2004; 27:553-597. [PubMed: 14747243]
- Umpierrez GE, Isaacs SD, Bazargan N, You X, Thaler LM, Kitabchi AE. Hyperglycemia: an independent marker of in-hospital mortality in patients with undiagnosed diabetes. J Clin Endocrinol Metab. 2002; 87:978-982. [PubMed: 11889147]
- Van den Berghe G, Wilmer A, Hermans G, et al. Intensive insulin therapy in the medical ICU. N Engl J Med. 2006; 354:449-461. [PubMed: 16452557]
- Van den Berghe G, Wouters P, Weekers F, et al. Intensive insulin therapy in the critically ill patients. N Engl J Med. 2001; 345:1359-1367. [PubMed: 11794168]
- Furnary AP, Gao G, Grunkemeier GL, et al. Continuous insulin infusion reduces mortality in patients with diabetes undergoing coronary artery bypass grafting. J Thorac Cardiovasc Surg. 2003;125:1007-1021. [PubMed: 12771873]
- Griesdale DE, de Souza RJ, van Dam RM, et al. Intensive insulin therapy and mortality among critically ill patients: a meta-analysis including NICE-SUGAR study data. CMAJ. 2009; 180:821-827. [PubMed: 19318387]
- Finfer S, Chittock DR, Su SY, et al. Intensive versus conventional glucose control in critically ill patients. N Engl J Med. 2009; 360:1283-1297. [PubMed: 19318384]
- Brunkhorst FM, Engel C, Bloos F, et al. Intensive insulin therapy and penta-starch resuscitation in severe sepsis. N Engl J Med. 2008; 358:125-139. [PubMed: 18184958]
- De La Rosa Gdel C, Donado JH, Restrepo AH, et al. Strict glycaemic control in patients hospitalized in a mixed medical and surgical intensive care unit: a randomised clinical trial. Crit Care. 2008;12:R120. [PubMed: 18799004]
- Preiser JC, Brunkhorst F. Tight glucose control and hypoglycemia. Crit Care Med. 2008; 36:1391. author reply 1391-1392. [PubMed: 18379293]
- Umpierrez GE, Kitabchi AE. ICU care for patients with diabetes. Curr Opin Endocrinol Diabetes Obes. 2004; 11:75-81.
- Goldberg PA, Siegel MD, Sherwin RS, et al. Implementation of a safe and effective insulin infusion protocol in a medical intensive care unit. Diabetes Care. 2004; 27:461-467. [PubMed:14747229]
- Davidson PC, Steed RD, Bode BW. Glucommander: a computer-directed intravenous insulin system shown to be safe, simple, and effective in 120,618 h of operation. Diabetes Care. 2005;28:2418-2423. [PubMed: 16186273]
- Juneja R, Roudebush C, Kumar N, et al. Utilization of a computerized intravenous insulin infusion program to control blood glucose in the intensive care unit. Diabetes Technol Ther. 2007; 9:232-240. [PubMed: 17561793]
- Kitabchi AE, Umpierrez GE, Murphy MB, et al. Hyperglycemic crises in diabetes. Diabetes Care. 2004; 27 (Suppl 1):S94-S102. [PubMed: 14693938]
- Markovitz LJ, Wiechmann RJ, Harris N, et al. Description and evaluation of a glycemic management protocol for patients with diabetes undergoing heart surgery. Endocr Pract. 2002;8:10-18. [PubMed: 11939754]
- Kitabchi AE, Freire AX, Umpierrez GE. Evidence for strict inpatient blood glucose control: timeto revise glycemic goals in hospitalized patients. Metabolism. 2008; 57:116-120. [PubMed: 18078868]
- Arabi YM, Dabbagh OC, Tamim HM, et al. Intensive versus conventional insulin therapy: a randomized controlled trial in medical and surgical critically ill patients. Crit Care Med. 2008;36:3190-3197. [PubMed: 18936702]
- Wiener RS, Wiener DC, Larson RJ. Benefits and risks of tight glucose control in critically ill adults: a meta-analysis. JAMA. 2008; 300:933-944. [PubMed: 18728267]
- Krinsley JS, Grover A. Severe hypoglycemia in critically ill patients: risk factors and outcomes. Crit Care Med. 2007; 35:2262-2267. [PubMed: 17717490]
- Cryer PE, Axelrod L, Grossman AB, et al. Evaluation and management of adult hypoglycemic disorders: an Endocrine Society Clinical Practice Guideline. J Clin Endocrinol Metab. 2009;94:709-728. [PubMed: 19088155]
- Oddo M, Schmidt JM, Carrera E, et al. Impact of tight glycemic control on cerebral glucose metabolism after severe brain injury: a microdialysis study. Crit Care Med. 2008; 36:3233-3238. [PubMed: 18936695]
- Razavi Nematollahi L, Kitabchi AE, Stentz FB, et al. Proinflammatory cytokines in response to insulin-induced hypoglycemic stress in healthy subjects. Metabolism. 2009; 58:443-448. [PubMed: 19303962]
- Dossett LA, Cao H, Mowery NT, et al. Blood glucose variability is associated with mortality in the surgical intensive care unit. Am Surg. 2008; 74:679-685. discussion 685. [PubMed: 18705566]
- Moghissi ES, Korytkowski MT, DiNardo M, et al. American Association of Clinical Endocrinologists and American Diabetes Association consensus statement on inpatient glycemic control. Diabetes Care. 2009; 32:1119-1131. [PubMed: 19429873]