![]()
Publication
Journal of Diabetes Science and Technology
Date
January 2018
Authors
Marina Rabinovich,1 Jessica Grahl,2 Emily Durr,1 Rita Gayed,1 Katleen Chester,1 Raymie McFarland,3 Barbara McLean3
ABSTRACT
Background: Insulin infusions are commonly utilized to control hyperglycemia in critically ill patients and decrease hyperglycemia associated complications. Safety concerns have been raised in trials evaluating methods of glycemic control regarding the incidence of hypoglycemia and its relationship to increased mortality. Electronic glycemic management systems (eGMS) may result in less variable blood glucose (BG) control and less hypoglycemia. This study aimed to compare BG control, time in target BG range, and the rate of hypoglycemia when critically ill patients were managed with an insulin infusion guided by paper-based protocol (PBP) versus eGMS.
Methods: This retrospective review compared critically ill patients ≥ 18 years old that received insulin infusion from March to May 2015 (PBP group) and October to January 2017 (eGMS group). The primary outcome was the incidence of hypoglycemia. Secondary outcomes included frequency and severity of hypoglycemia, duration in glycemic target, length of insulin therapy, as well as ICU and hospital length of stay.
Results: Fifty-four patients were evaluated, 27 in each group. Percentage of days with BG <70 mg/dL was significantly reduced after eGMS implementation (21.5% v 1.3%, P <.0001) including the frequency of severe hypoglycemia (BG <40 mg/dL) (5.4% v 0.01%, P <.0001). Patients in the eGMS group spent a greater amount of time in target BG range (31.5% v 63.7%, P <.0001).
Conclusion: An eGMS has the potential to address many of the unmet needs of an optimal glycemic control strategy, minimizing hypoglycemia, and glycemic variability in a heterogeneous critically ill population.
BACKGROUND
Tight glycemic control (historically defined as blood glucose [BG] 80-110 mg/dL) utilizing intensive, continuous insulin infusion regimens has been studied extensively in critically ill patients and has been proven to significantly decrease morbidity and mortality in patients with and without diabetes.1-5 Despite this information, methodology and safety of tight glycemic control continue to provoke controversy.4-7 The largest randomized multicenter trial in critically ill patients to date demonstrated that tight glycemic control targeting BG of 81-108 mg/dL was associated with higher 90-day mortality (27.5% vs 24.9%, P =.002) and higher incidence of hypoglycemia (6.8% vs 0.5%, p <0.001) compared to more conventional BG target of less than 180 mg/dL.6 Safety concerns have been raised in multiple randomized controlled trials comparing tight glycemic control versus conventional targets regarding the incidence of severe hypoglycemia (BG <40 mg/dL) and its relationship with increased mortality. Furthermore, numerous retrospective and prospective studies have demonstrated that hypoglycemia is an independent risk factor for increased mortality in the intensive care unit (ICU).10,11 In a retrospective observational study of 4946 critically ill patients the rate of hospital mortality approached 37% in patients who had experienced all-cause mild to moderate hypoglycemia (BG <81 mg/dL), in contrast to a mortality rate of 19.7% in patients without hypoglycemia (P <.001). After adjusting for insulin therapy, hypoglycemia was independently associated with an increased risk of death, particularly from cardiovascular and infectious disease.12 Krinsley and Grover reported that even a single episode of severe hypoglycemia (BG <40 mg/dL) in critically ill patients was significantly associated with an increased risk of mortality (OR, 2.28; 95% CI, 1.41-3.70; P =.0008).10
A considerable amount of literature and evidence-based guidelines indicate that BG management in critically ill patients guided by protocol-driven intravenous (IV) insulin administration with predefined dosing adjustments leads to improved patient outcomes.12-15
While most hospitals continue to utilize paper-based protocols (PBP), there are numerous reports indicating superiority of electronic glycemic management systems (eGMS) in glucose control for critically ill surgical and medical patients. The eGMS methods result in tighter, faster, and less variable control, with less associated hypoglycemia.16-20 Fogel and colleagues also discovered a temporal decrease in health-care-acquired infections (ventilator-associated pneumonia, catheter-associated urinary tract infections, and central line-associated blood stream infections) when using eGMS.17
Grady Health System (GHS) is a large, urban, academic medical center with a Level 1 trauma service, Neuroscience center, one of the largest Burn centers in the Southeast, and 24/7 cardiac catheterization and percutaneous intervention services. Prior to October 2016, GHS utilized a PBP for insulin infusions targeting a BG of 110-180 mg/dL for non-DKA-associated hyperglycemia in critically ill patients. Evaluation of the efficacy and safety of the hospital’s PBP revealed high rates of moderate (BG <70 mg/dL) and severe (BG <40 mg/dL) hypoglycemia in medical, surgical, neuroscience, and burn ICU patients. In October 2016, GHS transitioned to an eGMS (Glucommander™, Glytec, Waltham, MA) to facilitate the management of non-DKA-associated hyperglycemia in critically ill patients. This study was designed to compare BG control, time in target BG range and the rate of hypoglycemia when critical patients in the four ICUs were managed with an eGMS versus a PBP.
METHODS
The study was approved by the institutional review board and hospital-specific research oversight committee. This retrospective review was conducted comparing critically ill patients 18 years of age or older in the medical, surgical/trauma, neuroscience and burn intensive care units that received an insulin infusion from March 2015 through May 2015 (PBP group) and October 2016 through January 2017 (eGMS group). Pregnant women, prisoners and patients with diabetic ketoacidosis (DKA) or hyperglycemic hyperosmolar state were excluded.
Glucose management software utilizes multivariate algorithms to provide insulin dosing recommendations. The software continuously recalculates dosing and dynamically adjusts to each individual patient’s sensitivities and other clinical variables. It uses an insulin sensitivity calculation factor, referred to as a “multiplier,” which determines the slope of correction of BG toward the target. Although the initial multiplier is chosen by the provider based on the clinical circumstance, the factor subsequently becomes dynamic and adjusts with each BG measurement. The initial provider choice consists of three different factors: 0.01 (“sensitive”) for elderly patients, patients with renal disease and/or diabetes; 0.02 (“standard”) for adult patients without the above conditions; and 0.05 for postoperative cardiac surgery patients. The eGMS integrates with electronic medical record (EMR) systems and connected devices for point of care testing as well as easy interface with other data, allowing for individualized insulin titration based on the patient’s BG response to previous insulin infusion rates. The eGMS software also produces an audible alarm when a BG check is due, providing a reminder to nursing and support staff to complete timely BG monitoring.
Prior to eGMS implementation, the Theradoc® clinical surveillance system was utilized to identify episodes of hypoglycemia in all critically ill patients. GHS’s EMR was utilized to determine if patients were receiving IV insulin therapy during the time of hypoglycemia as well as to collect other pertinent data points. Prior to the implementation of an eGMS, critically ill patients requiring an insulin infusion for non-DKA hyperglycemia were managed using a nurse-driven PBP targeting BG of 110-180 mg/dL. The PBP instructed the nurse to adjust the insulin infusion rate based on hourly BG checks and the degree of BG change (different rate adjustments depending on BG decrease of more or less than 30 mg/dL from previous BG). Automated hourly prompts and alarms for the nurse to check the BG were not available with the PBP as they are with the eGMS. Per the PBP, the nurse was advised to note any changes in a patient’s renal function, nutritional or clinical status, or medications (e.g., steroids or vasopressors) and to adjust the BG monitoring frequency accordingly. Of note, the standard of care at this institution regarding nurse-to-patient ratios remained the same during the PBP study period and eGMS study period.
At the time of the eGMS deployment, the BG target while on an insulin infusion was changed to 140-180 mg/dL to comply with evidence-base practice and guideline recommendations.15 To account for the differences in target BG range between the two groups, data analysis and reporting for this study were performed based on a standardized range of 110-180 mg/dL. Data collected included: age, sex, race, body mass index (BMI), past medical history (chronic kidney disease and diabetes mellitus), admitting service, insulin administration, and BG levels.
This evaluation aims to compare the safety and efficacy of two insulin infusion titration and BG monitoring protocols. While the two protocols vary in several ways, this evaluation compares each insulin infusion strategy in its entirety, including any differences in protocol design between the PBP and the eGMS. The primary outcome measure was the incidence of hypoglycemia in critically ill patients receiving an insulin infusion per PBP (pre-eGMS) compared to utilization of an eGMS (post-eGMS). Secondary outcome measures included determining the severity of hypoglycemia, duration in glycemic target range, length of insulin therapy, frequency of hypoglycemic episodes per patient as well as ICU and hospital length of stay.
STATISTICAL ANALYSIS
Metrics comparisons between PBP group and eGMS group were performed either by parametric two-sample t-test or nonparametric Wilcoxon rank sum test, depending on whether the data followed a normal distribution or a nonnormal distribution. Nonparametric bootstrap was performed afterward to calculate P-values. A P-value of <.05 was considered significant. Statistical analysis was performed using R v3.3.1 software.
RESULTS
A total of 54 patients were included in the analysis, 27 in the PBP group and 27 in the eGMS group. Demographics are described in Table 1. The groups were evenly matched based on gender (51.9 v 48.1% male), age (62.1 v 60.6 years), and race (62.9 v 59.3% Caucasian, NS) with a median ICU length of stay of 3.6 versus 3.2 days in the PBP and eGMS groups, respectively. The majority of patients in both groups had a diagnosis of diabetes, with a mean hemoglobin A1C of 8.4 in PBP group and 9.2 in eGMS group (P =.18). Table 2 outlines the total number and frequency of BG checks as well as duration of treatment with an IV insulin infusion protocol. A dataset of 7467 BG measurements was available for analysis. Patients in the PBP group were treated for a median of 45.8 hours compared to 50.2 hours in the eGMS cohort (P =NA), with a mean insulin infusion rate of 0.52 ± 0.43 units/kg/day in the PBP group and 0.69 ± 0.54 units/kg/day in the eGMS group (P =.04).
Table 1. Demographics and Baseline Characteristics
| Characteristic | PBP (n = 27) | eGMS (n = 27) | P value |
|---|---|---|---|
| Male Gender, n (%) | 14 (51.9%) | 13 (48.1%) | .67 |
| Age, mean years ± SD | 62.1 ± 12.8 | 60.6 ±13.9 | .5 |
| Race, n (%) | .72 | ||
| Caucasian | 17 (62.9%) | 16 (59.3%) | |
| African American | 8 (29.6%) | 8 (29.6%) | |
| Other | 2 (7.5%) | 3 (11.1%) | |
| BMI, mean kg/m2 ± SD | 29.1 ± 10.7 | 32.2 ± 8.6 | .03 |
| Admission BG, mean mg/dL ± SD | 230.3 ± 163.2 | 317.3 ± 172.1 | .0001 |
| Hemoglobin A1C, mean ± SD | 8.4 ± 3 | 9.2 ± 3.8 | .18 |
| ICU type, n (%) | .62 | ||
| Medical | 10 (37.0%) | 9 (33.3%) | |
| Neuro | 5 (18.5%) | 5 (18.5%) | |
| Surgical/Trauma | 8 (29.6%) | 10 (37.0%) | |
| Burn | 4 (14.8%) | 3 (11.1%) |
Table 2. BG Management and Characteristics
| Variable | PBP (n = 27) | eGMS (n = 27) | P value |
|---|---|---|---|
| Total BG Measurements | 3391 | 4076 | .01 |
| BG Measurement Per Patient, mean mg/dL | 125.6 | 150.9 | .03 |
| Insulin Infusion Rate, mean units/kg/day ± SD | 0.52 ± 0.43 | 0.69 ± 0.54 | .04 |
| Time on Treatment Algorithm, median hours | 45.8 | 50.2 | NA |
| BG at Insulin Infusion Discontinuation, mean mg/dL ± SD | 150.8 ± 78.8 | 113.0 ± 49.5 | .001 |
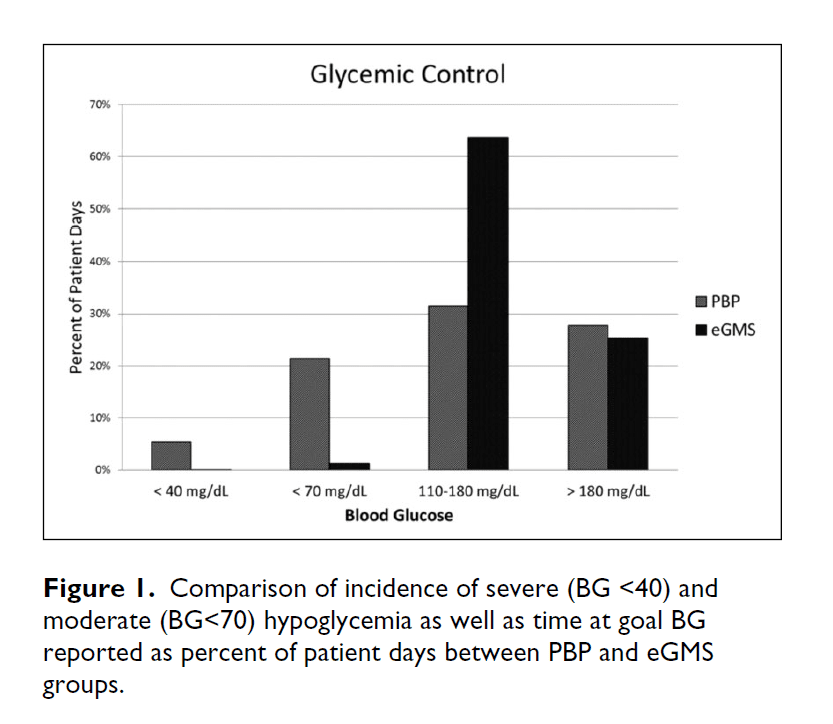
The primary outcome measure focused on rate of hypoglycemia in each treatment group. The percentage of treatment days with hypoglycemic episodes for the BG <70 mg/dL was significantly reduced after an eGMS implementation (21.5% in PBP group and 1.3% in eGMS group, P <.0001) (Table 3). The frequency of severe hypoglycemia (BG <40 mg/dL) was also significantly reduced from the PBP to the eGMS group (5.4% v 0.01%, P <.0001). In PBP group, on average 2.5 hours elapsed from the last BG check to hypoglycemic event compared to 1.5 hours in eGMS group (p=0.001). Patients who were managed using eGMS spent a greater amount of time in target BG range (31.5% v 63.7%, P <.0001), as well as experienced less glucose variability (defined as any % BG/pt days <70 or >180) with the eGMS (Figure 1).
Table 3. Outcomes Measures
| Measure | PBP (n = 27) | eGMS (n = 27) | P value |
|---|---|---|---|
| Primary Outcomes | |||
| Incidence of Hypoglycemia (BG <70 mg/dL), % patient days on infusion | 21.46% | 1.27% | <.0001 |
| Incidence of Severe Hypoglycemia (BG <40 mg/dL), % patient days on infusion | 5.37% | 0.01% | <.0001 |
| Number of Hypoglycemic Episodes Per Patient, mean (range) | 1.5 (1-5) | 1.1 (1-2) | .01 |
| BG for Hypoglycemic Event, mean mg/dL ± SD (range) | 55.2 ± 12.5 (18-69) | 53.4 ± 12.5 (32-69) | .1 |
| Secondary Outcomes | |||
| Time in Target (BG 110-180 mg/dL), % patient days | 31.52% | 63.71% | <.0001 |
| Hyperglycemia (BG >180 mg/dL), % patient days | 27.81% | 25.29% | .47 |
| BG Variability, % patient days <70 mg/dL or >180 mg/dL | 49.27% | 26.56% | .001 |
| ICU LOS, median days (IQR) | 3.63 (5.10) | 3.18 (4.23) | |
| Hospital LOS, median days (IQR) | 7.86 (7.14) | 6.07 (11.5) | |
| Other Outcomes (Prior to Hypoglycemic Event) | |||
| Days on Infusion, mean ± SD | 4.1 ± 4.9 | 2.5 ± 2.97 | .01 |
| Time to Hypoglycemic Event from Last BG Check, hours | 2.5 ± 1.0 | 1.5 ± 0.5 | .001 |
| Last BG Value Prior to Hypoglycemic Event, mean mg/dL ± SD | 134.1 ± 48.8 | 105.3 ± 46.5 | .001 |
DISCUSSION
This retrospective study demonstrates that in critically ill patients with hyperglycemia who require a continuous insulin infusion, a strategy of eGMS and decision support yields significantly lower rates of hypoglycemia and greater amount of time in target BG range compared to a PBP. To our knowledge, this is the first comparison of an eGMS in a heterogeneous critically ill patient population consisting of surgical/trauma, medical, burn, and neurocritical care patients at a large, urban academic medical center. These patients are particularly unique because of many intensive care-related factors that can influence glycemic response and variability. Frequent BG monitoring, close attention to identifiable risk factors for hypoglycemia, and proper titrations of an insulin infusion are critical for detecting and preventing hypoglycemia and maintaining target glycemic control.
Timely correction of hyperglycemia in critically ill patients has been shown to reduce mortality and the incidence of surgical site infections; however, the potential for high rates of hypoglycemia is imminent and can negate the benefits of tight glycemic control since hypoglycemia and glucose variability are also associated with significant morbidity and mortality.12,15
Several variables may influence the quality and impact of glycemic control in the ICU including arterial hypotension, shock, vasoconstriction, edema, and ischemia interfering with obtaining an accurate BG reading. In addition, several disease processes and management strategies aside from insulin therapy may influence glycemic control such as mechanical ventilation, renal replacement therapy, sepsis, glucocorticoids and vasopressor therapy, and nutritional status leading to glucose variability.4,9,11,13
The findings in this evaluation are consistent with those from previous comparisons of eGMS and PBPs in other clinical settings, primarily comparing cardiothoracic surgery patients.19-21 In a recent study of bone marrow transplant patients, who like critically ill patients have substantially higher rates of morbidity and mortality, the feasibility of an eGMS was prospectively evaluated. In this cohort of 21 instances of hyperglycemia managed with eGMS, the rate of hypoglycemia defined as BG <70 mg/dL was 0.9% and no patients experienced BG levels less than 40 mg/dL. This study evaluated BG control before eGMS implementation, during eGMS, and after switching back to a PBP and demonstrated wide variability in glucose level before and after eGMS, while maintaining targeted BG level in 61% of the time while on eGMS. In addition to unique cross-over design this study was done in a complex patient population with high morbidity, mortality, total parenteral nutrition utilization and inflammatory responses which are also experienced in critically ill patients.22
Our study demonstrates that glycemic variability may also be reduced by utilization of an eGMS compared to a PBP. Coupled with hypoglycemia, increasing glycemic variability has been described as a strong independent predictor of mortality regardless of patients’ mean glucose concentration.23,24
One of the observed advantages of eGMS is the frequent reminders to measure BG at specified times based on patient-specific glycemic response. Conversion to an eGMS at our institution enabled improved adherence to timely BG checks, which allowed more timely insulin infusion rate adjustments resulting in less hypoglycemia.
We acknowledge several limitations of this analysis including the retrospective methodology and relatively small number of subjects. In addition, this was a single-center analysis of patients at an urban academic medical center, thus the findings cannot be generalized to all institutions. Moreover, although the data in the eGMS cohort was corrected to a range of 110-180 mg/dL to match the target range in the PBP group, the eGMS algorithm actually targets a range of 140-180 mg/dL. The reduced lower limit of 110 mg/dL in PBP group versus 140 mg/dL in eGMS group may have inherently posed a higher hypoglycemic risk in our control group. Our analysis did not take nutritional status (enteral or parenteral nutrition) or dextrose containing IV fluid administration into account, which correlates with insulin requirements. One must also consider that human factors play a significant role in the successful implementation of any electronic system which requires timely data upload and immediate response. An eGMS has the potential to address many of the unmet needs of an optimal glycemic control strategy; however, the rigorous response time and alert/alarm prompts, although essential, may create more burdens on the nursing staff in the initial periods of implementation. This study did not evaluate nursing perception of eGMS compared to PBP on daily workload but revealed a more timely response by nursing staff to frequency of BG checks.
CONCLUSION
In conclusion, the ideal method for controlling glucose uses a proven algorithm to calculate insulin dose titrations, is easy to use with minimal burden on nursing workload, automated, and easily interfaces with other patient measurements and data by integrating into existing hospital systems to prevent the need for repeated data entry. It quickly corrects hyperglycemia, consistently maintains glucose within the predetermined optimal range with minimal variability, and does not result in episodes of hypoglycemia. This study suggests that compared to a PBP, an eGMS may be helpful for minimizing hypoglycemia and glycemic variability in a heterogeneous critically ill population by individualizing insulin titration based on patient’s response and by providing reminders for staff for timely BG checks. Larger studies and further evaluation of eGMS in critically ill patients are needed to validate the findings of this study.
Acknowledgements
Data analysis was delivered by MSHA Quality and Clinical Excellence.
Abbreviations
BG, blood glucose; BMI, body mass index; DKA, diabetic ketoacidosis; DM, diabetes mellitus; eGMS, electronic glycemic management system; EMR, electronic medical record; GHS, Grady Health System; ICU, intensive care unit; IV, intravenous; PBP, paper-based protocol.
Declaration of Conflicting Interests
The author(s) declared the following potential conflicts of interest with respect to the research, authorship, and/or publication of this article: RM is employed by Glytec, Waltham, MA.
Funding
The author(s) received no financial support for the research, authorship, and/or publication of this article.
AFFILIATIONS
- Grady Health System, Atlanta, GA, USA
- Vanderblt University Medical Center, Nashville, TN, USA
- Glytec, Waltham, MA, USA
REFERENCES
- Falciglia M, Freyberg RW, Almenoff PL, D’Alessio DA, Render ML. Hyperglycemia-related mortality in critically ill patients varies with admission diagnosis. Crit Care Med. 2009;37(12):3001-3009.
- Krinsley JS. Association between hyperglycemia and increased hospital mortality in a heterogeneous population of critically ill patients. Mayo Clin Proc. 2003;78(12):1471-1478.
- Umpierrez GE, Isaacs SD, Bazargan N, You X, Thaler LM, Kitabchi AE. Hyperglycemia: an independent marker of in-hospital mortality in patients with undiagnosed diabetes. J Clin Endocrinol Metab. 2002;87(3):978-982.
- Van den Berghe G, Wouters P, Weekers F, et al. Intensive insulin therapy in critically ill patients. N Engl J Med. 2001;345(19):1359-1367.
- Van den Berghe G, Wilmer A, Hermans G, et al. Intensive insulin therapy in the medical ICU. N Engl J Med. 2006;354(5):449-461.
- Finfer S, Chittock DR, Su SY, et al. Intensive versus conventional glucose control in critically ill patients. N Engl J Med. 2009;360(13):1283-1297.
- Preiser JC, Devos P, Ruiz-Santana S, et al. A prospective randomised multi-centre controlled trial on tight glucose control by intensive insulin therapy in adult intensive care units: the Glucontrol study. Intensive Care Med. 2009;35(10):1738-1748.
- Preiser JC, Devos P. Clinical experience with tight glucose control by intensive insulin therapy. Crit Care Med. 2007;35(suppl 9):S503-S507.
- Arabi YM, Tamim HM, Rishu AH. Hypoglycemia with intensive insulin therapy in critically ill patients: predisposing factors and association with mortality. Crit Care Med. 2009;37(9):2536-2544.
- Krinsley JS, Grover A. Severe hypoglycemia in critically ill patients: risk factors and outcomes. Crit Care Med. 2007;35(10):2262-2267.
- Goldberg PA, Siegel MD, Sherwin RS, et al. Implementation of a safe and effective insulin infusion protocol in a medical intensive care unit. Diabetes Care. 2004;27(2):461-467.
- Egi M, Bellomo R, Stachowski E, et al. Hypoglycemia and outcome in critically ill patients. Mayo Clin Proc. 2010;85(3):217-224.
- Rea RS, Donihi AC, Bobeck M, et al. Implementing an intravenous insulin infusion protocol in the intensive care unit. Am J Health Syst Pharm. 2007;64(4):385-395.
- Nazer LH, Chow SL, Moghissi ES. Insulin infusion protocols for critically ill patients: a highlight of differences and similarities. Endocr Pract. 2007;13(2):137-146.
- Moghissi ES, Korytkowski MT, DiNardo M, et al. American Association of Clinical Endocrinologists and American Diabetes Association consensus statement on inpatient glycemic control. Diabetes Care. 2009;32(6):1119-1131.
- Newton CA, Smiley D, Bode BW, et al. A comparison study of continuous insulin infusion protocols in the medical intensive care unit: computer-guided vs. standard column-based algorithms. J Hosp Med. 2010;5(8):432-437.
- Fogel SL, Baker CC. Effects of computerized decision support systems on blood glucose regulation in critically ill surgical patients. J Am Coll Surg. 2013;216(4):828-833; discussion 833-825.
- Pachler C, Plank J, Weinhandl H, et al. Tight glycaemic control by an automated algorithm with time-variant sampling in medical ICU patients. Intensive Care Med. 2008;34(7): 1224-1230.
- Eslami S, Abu-Hanna A, de Jonge E, de Keizer NF. Tight glycemic control and computerized decision-support systems: a systematic review. Intensive Care Med. 2009;35(9): 1505-1517.
- Tanenberg RJ, Hardee S, Rothermel C, Drake AJ. Use of a computer-guided glucose management system to improve glycemic control and address national quality measures: a 7-year, retrospective observational study at a tertiary care teaching hospital. Endocr Pract. 2017;23(3):331-341.
- Mukherjee K, Albaugh VL, Richards JE, Rumbaugh KA, May AK. Glycemic control in critically ill surgical patients: risks and benefits. Open Access Surgery. 2015;8:27-42.
- Espina C, Jenkins I, Taylor L, et al. Blood glucose control using a computer-guided glucose management system in allogeneic hematopoietic cell transplant recipients. Bone Marrow Transplant. 2016;51(7):973-979.
- Krinsley JS. Glycemic variability: a strong independent predictor of mortality in critically ill patients. Crit Care Med. 2008;36(11):3008-3013.
- Ali NA, O’Brien JM, Dungan K, et al. Glucose variability and mortality in patients with sepsis. Crit Care Med. 2008;36(8):2316-2321.