Comparison of Hyperglycemia Management Protocols in the ICU: Standard Protocol versus eGlycemic Management System
![]()
Presentation
American Diabetes Association Scientific Sessions
Date
June 2019
Authors
Jordan Messler,1 Guillermo Umpierrez2
BACKGROUND
A variety of continuous insulin infusion (CII) algorithms are available to improve and maintain glycemic control in the ICU. American Diabetes Association guidelines state that: (a) insulin therapy should be initiated for patients with persistent hyperglycemia >180 mg/dL, (b) a target glucose range of 140-180 mg/dL is recommended for the majority of patients, and (c) more stringent goals, such as 110-140 mg/dL may be appropriate for selected patients if this can be achieved without significant hypoglycemia.
In December 2016, Grady Hospital, a community-based academic medical center with 640 beds, acquired an electronic glycemic management system for use in our ICUs and step-down units (specifically, the eGlycemic Management System® featuring Glucommander™, a product of Glytec).
We present our experience with the eGlycemic Management System® (eGMS®) over a two-year period from December 2016 to December 2018, and we compare glycemic control between patients whose insulin infusion was managed with eGMS® to patients whose insulin infusion was managed with usual care (i.e., “standard protocol”).
| DEMOGRAPHICS | eGMS® | Usual Care |
|---|---|---|
| Number of Patients | 926 | 1,971 |
| Average Age (Yrs) | 59 | 57 |
| Gender – Male | 49.89% | 65.52% |
| Gender – Female | 50.11% | 34.48% |
| Average BMI | 33 | 28 |
| Average A1C | 8.51% | 7.53% |
METHODS
We conducted a retrospective review of critical care patients with persistent hyperglycemia >180 mg/dL who received insulin infusion in an ICU or step-down unit. Among a total of 2,897 patients, 926 (32%) were managed with eGMS® and 1,971 (68%) were managed with usual care.
The primary endpoint of our review was the percentage of blood glucose (BG) readings in the target range of 70-180 mg/dL. Secondary outcomes included the rate of severe hyperglycemia >250 mg/dL measured as the percentage of BG readings and the rates of hypoglycemia <40 mg/dL, <54 mg/dL and <70 mg/dL measured as both the percentage of BG readings and the percentage of patient days.
RESULTS
| MEASUREMENTS | eGMS® | Usual Care | Difference in Rate | p Value |
|---|---|---|---|---|
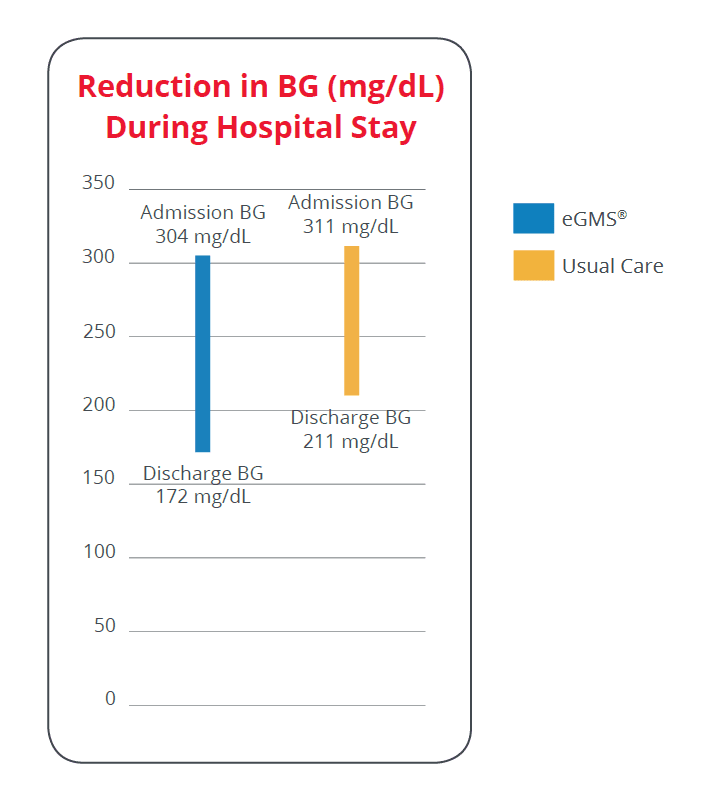
| Average Admission BG (mg/dL) | 304 ± 201.37 | 311 ± 188.00 | N/A | — |
| Average Discharge BG (mg/dL) | 172 ± 70.60 | 211 ± 83.60 | N/A | — |
| Average Reduction in BG During Stay (mg/dL / %) | 132 (43.4%) | 100 (32.2%) | 32.4% greater with eGMS® | — |
| % BGs 70-180 mg/dL | 69.80% | 66.34% | 5.2% more with eGMS® | <0.01 |
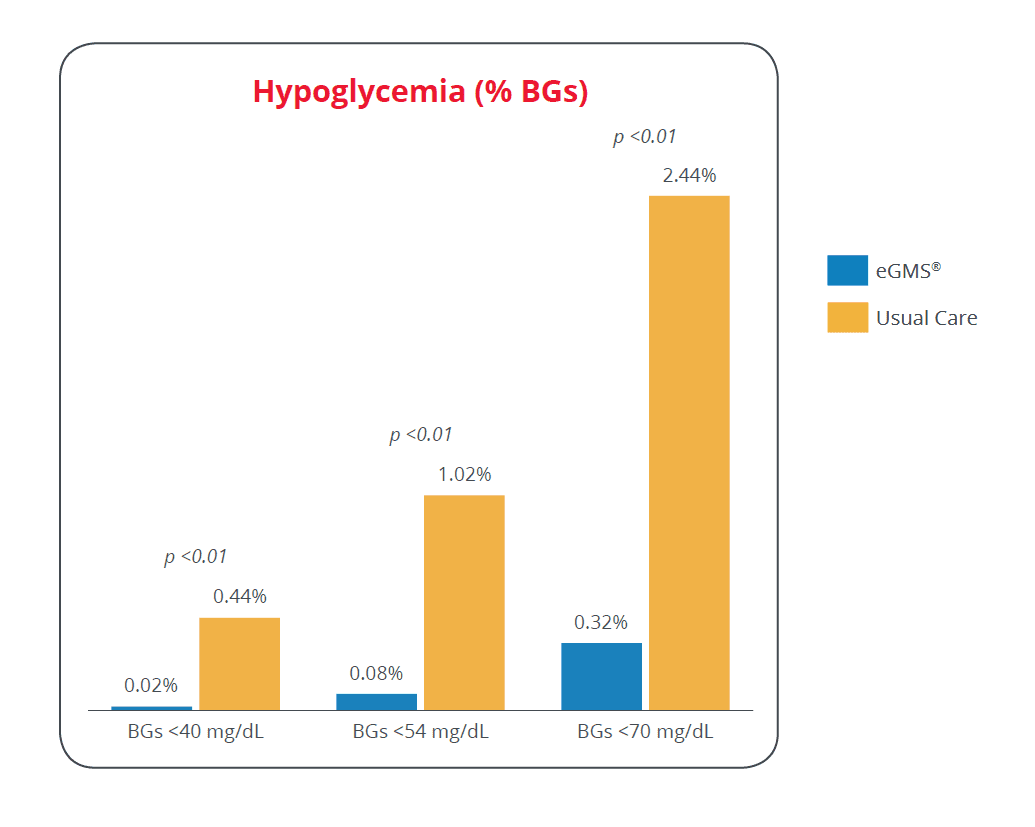
| % BGs <40 mg/dL | 0.02% | 0.44% | 95.5% less with eGMS® | <0.01 |
| % BGs <54 mg/dL | 0.08% | 1.02% | 92.2% less with eGMS® | <0.01 |
| % BGs <70 mg/dL | 0.32% | 2.44% | 86.9% less with eGMS® | <0.01 |
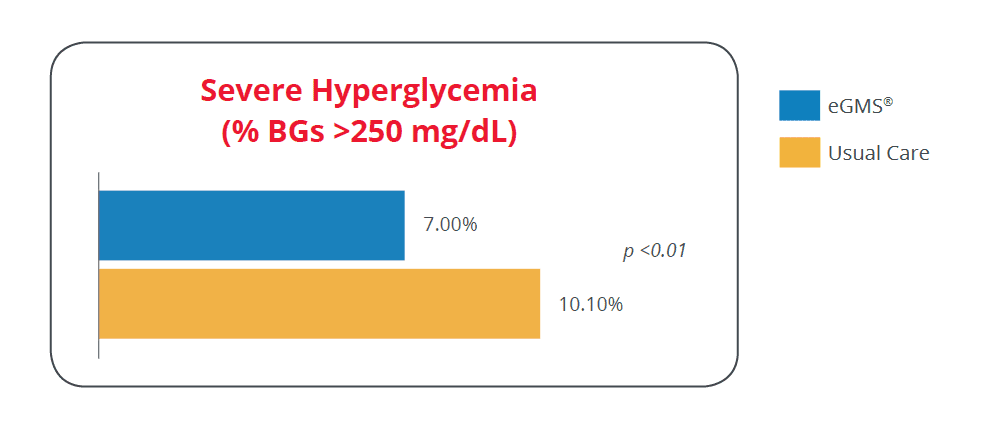
| % BGs >250 mg/dL | 7.00% | 10.10% | 30.7% less with eGMS® | <0.01 |
| % Patient Days with BG <40 mg/dL | 0.19% | 1.19% | 84.0% less with eGMS® | <0.01 |
| % Patient Days with BG <54 mg/dL | 0.79% | 2.56% | 69.1% less with eGMS® | <0.01 |
| % Patient Days with BG <70 mg/dL | 2.97% | 5.70% | 47.9% less with eGMS® | <0.01 |
CONCLUSION
Use of eGMS® to manage insulin infusion was superior to usual care in improving glycemic control of critical care patients in the ICUs and step-down units. This included reductions in hypoglycemia, severe hyperglycemia and average blood glucose during the hospital stay. It also included a greater percentage of patients in the target blood glucose range.
AFFILIATIONS
- Glytec – Waltham, MA
- Emory University School of Medicine – Atlanta, GA